Web GIS on a Shoestring
This is a live streamed presentation. You will automatically follow the presenter and see the slide they're currently on.
This is a live streamed presentation. You will automatically follow the presenter and see the slide they're currently on.
By Brent Porter
Center for Space Research
University of Texas at Austin
http://www.slides.com/organizedchaos/deck-8/live/
What about GIS App Servers???
GIS App Servers are great
I use several different flavors
(ArcGIS Server, GeoServer, MapServer...)
But...
The cost of entry is too high for some
I am talking about opportunity cost here -
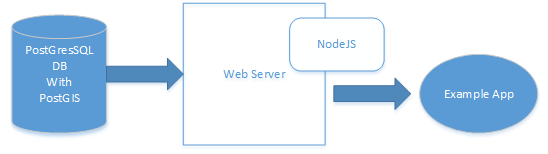
I will be using the following open source technologies
* shoestring - in this context means related to hardware
Postgresql
Postgresql - gdal
ogr2ogr -f "PostgreSQL" PG:"dbname=geodb
user=<your user> password=<your password>"
NamedJSONFile.json -nln
Name_Of_Table_In_Database -append{"type":"FeatureCollection",
"features":
[{
"type":"Feature","properties": {
"Description": "S0904A0324C_3919_Port_Aransas_Building_Damage",
"County": "Nueces",
"Longitude": "-97.049607",
"Latitude": "27.834263",
"Source_Image": "http://web.corral.tacc.utexas.edu/CSR/Public/17harvey/TxCAP/20170904/S0904A0324C/S0904A0324C_3919.JPG",
"Thumbnail": "http://web.corral.tacc.utexas.edu/CSR/Public/17harvey/TxCAP/20170904/S0904A0324C/thumbnails/S0904A0324C_3919_tn.JPG"
},"geometry":{"type":"Point","coordinates":[-97.049607,27.834263]}},
{
"type":"Feature","properties":{"Description": "S0904A0324E_4497_Port_Aransas_Building_Damage",
"County": "Nueces",
"Longitude": "-97.05198",
"Latitude": "27.838837",
"Source_Image": "http://web.corral.tacc.utexas.edu/CSR/Public/17harvey/TxCAP/20170904/S0904A0324E/S0904A0324E_4497.JPG",
"Thumbnail": "http://web.corral.tacc.utexas.edu/CSR/Public/17harvey/TxCAP/20170904/S0904A0324E/thumbnails/S0904A0324E_4497_tn.JPG"
},"geometry":{"type":"Point","coordinates":[-97.05198,27.838837]}},...Example GeoJSON
WHEN xMinIn,yMinIn,xMaxIn,yMaxIn For a Bounding Box
"SELECT *,ST_XMax(wkb_geometry) as lon_node,ST_YMax(wkb_geometry) as lat_node,
(ST_AsGeoJSON(wkb_geometry)) as locale FROM tx_cap_photo_repository WHERE ST_Intersects"+
"(ST_MakeEnvelope("+xMinIn+","+yMinIn+", "+xMaxIn+","+yMaxIn+", 4326),
tx_cap_photo_repository.wkb_geometry)";

Returns a collection of points that are within the bounding box (for GPS Photo Collection)

AND
"SELECT row_to_json(fc)"+
        "FROM (SELECT 'FeatureCollection' As type, array_to_json(array_agg(f)) As features "+
        "FROM (SELECT 'Feature' As type, "+
        "    ST_AsGeoJSON(lg.wkb_geometry)::json As geometry,"+
        "    (SELECT row_to_json(t) "+
        "FROM (SELECT id, qpf) t ) As properties "+
        "FROM qpf24hr_day1_oct14 As lg   ) As f )  As fc;";

Returns
{"type":"FeatureCollection","features":[{"type":"Feature","geometry":{"type":"Polygon",
"coordinates":[[[-121.4,52.08],[-120.6,51.6],[-120.35,51.09],[-120.32,50.62],[-120.67,49.87],
[-120.65,49.16],[-121.4,52.08]...]]},"properties":{"id":1,"qpf":0.01}}]}
Built-in Functions like ST_XMAX([spatialField]),
ST_AsGeoJSON([spatialField]) & array_to_json([inputArray])
To go along with that SQL query from before - where we are constructing JSON
from the tables in the database, this is the url pattern that will initiate
that call to get the forecast rain

forecastRainRouter.get('/DataLookup/Forecast/',cors(),query_QPF_1Day,
function(req,res,next){
        res.json(req.qpfForecast);
});


function query_QPF_1Day(req,res,next){
        var sqlQJson = <see earlier code for sql query>
        postgres.client.query(sqlQJson, function (err, results) {
            if (err) {
                console.error(err);
                res.statusCode = 500;
                return res.json({errors: ["Could not retrieve Forecast Rain"]});
            }
            // No results returned mean the object is not found
            if (results.rows[0].Description === null || results.rows.length === 0
            || results == null) {
                // We are able to set the HTTP status code on the res object
                res.statusCode = 404;
                return res.json({errors: ["Forecast Rain not found"]});
            }
            // console.log(results.rows[0]);
            req.qpfForecast = results.rows[0].row_to_json;
            next();
        });
    }
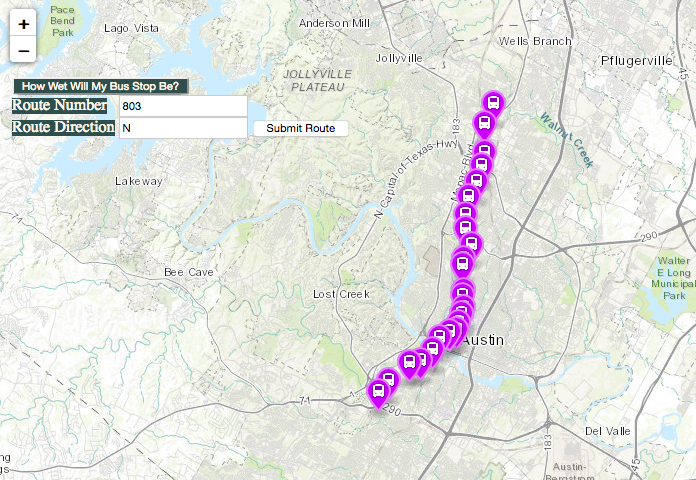
I am getting the bus stops and pick up times from Capital Metro -
so in this case, my routes are a proxy or pass through to their data
Note the :route, :stopid and :dir paramterizations
    var capMetroRouter = express.Router();
    //Query CapMetro Route Stops for Given Direction
    capMetroRouter.get('/DataLookup/Capmetro/:route/:dir',cors(),queryCapMetro, function(req,res,next) {
       res.json(req.capRoutes);
    });

    //query CapMetro Upcoming Pickup Times
    capMetroRouter.get('/DataLookup/Capmetro/StopTimes/:route/:stopid',cors(),queryCapMetroUpcomingPickupTimes, function(req,res,next) {
        res.json(req.stopTimes);
    });

    capMetroRouter.param('route', function (req, res, next, route) {
        console.log("Testing on " + route);
        if (isInt(route)) {
            req.route = route;
            next();
        } else {
            res.statusCode = 404;
            return res.json({errors: ["Route not constructed correctly or not recognized - please use numbers only"]});
        }});
    function queryCapMetro(req,res,next){
        fetch('https://www.capmetro.org/planner/s_routetrace.asp?route='+req.params.route+
        '&dir='+req.params.dir+'&stoptrace=B&opt=1&cmp=1')
            .catch(function(err) {
             return res.json({errors: ["Error Will Robinson - Danger Danger!!"]});})
            .then(function(response) {
                return response.json();
            }).then(function(json){
                req.capRoutes = json.stops;
                next();});}
So Let's focus in on Leaflet's GeoJSON features
L.geoJSON(data, {
    style: function (feature) {
        return {color: feature.properties.color};
    }
}).bindPopup(function (layer) {
    return layer.feature.properties.description;
}).addTo(map);function gatherForecastData(){
var jqxhrCountyDeclarations = $.ajax({
crossDomain: true,
url: '<Your NodeJS Application URL:Port>/api/DataLookup/Forecast/'
}).err(function(err){
return {error: err.msg};
}).done(function (data) {
drawForecastRain(data)
});
}
function drawForecastRain(qpfDay1Incoming){
geoJsonQPF_Day1 = L.geoJson(qpfDay1Incoming,
{
style: function(feature) {
switch (feature.properties.qpf) {
case 0.010000:return {color: "#79FA00",fillOpacity:0.45,weight: 0.2};
case 0.1: return {color: "#00CF00",fillOpacity:0.45,weight: 0.2};
case 0.25: return {color: "#008C00",fillOpacity:0.45,weight: 0.2};
...
default:
return {color: '#00008A'};
break;
}}});
map.addLayer(geoJsonQPF_Day1);
}function drawCapMetroPoints(incomingPoints,incomingRoute){
...
markers = [];
$.each(incomingPoints,function(key, value){
var latLngIn = value.latLng;
var strAry = latLngIn.split(",");
var marker = new L.Marker(new L.latLng(strAry[0],strAry[1]), {
icon: new L.MakiMarkers.icon({
icon: "bus",
color: "#cc00ff",
size: "m"
})
}).bindPopup(
"<p style='background-color: #cccccc'><span style='font-weight:bold'>"+
"Stop Id </span>" + value.id +"<br/><span class='stopTimesRetrieval'"+
"style='font-weight:bold'>Click for Stop Times: <span style='color:red'"+
"id='"+value.id+"'>" + value.id +
"</span></span><br/><span style='font-weight:bold'>Lat/Lng: </span>" +
strAry[0] + ", " + strAry[1] + "</p>")";
var tmpValId = '#' + value.id;
jQuery(document).on('click', tmpValId, function(event){
stopTimes(tmpValId.substr(1),incomingRoute);
});
markers.push(marker);
});
for(var j=0;j<markers.length;j++) {
map.addLayer(markers[j]);
}}
Doesn't using those ESRI basemaps cost $$$???
Nope! ESRI generously provides access to those basemaps free of charge
Total Cost* $0!
PAAS is Platform as a Service
I hope this talk encourages you to look at and experiment with open source libraries and how they can be used with a modicum of effort to create interesting applications with both commercial and free data sources
All code (including the example web app) is up on Github -
https://github.com/brentporter/ShoeStringWebGIS
Questions?