A 10 year journey into dataviz
June 24, 2017
@maartenzam
Torino
A selection of my projects and the tools behind them
2007


2011

Summer 2014


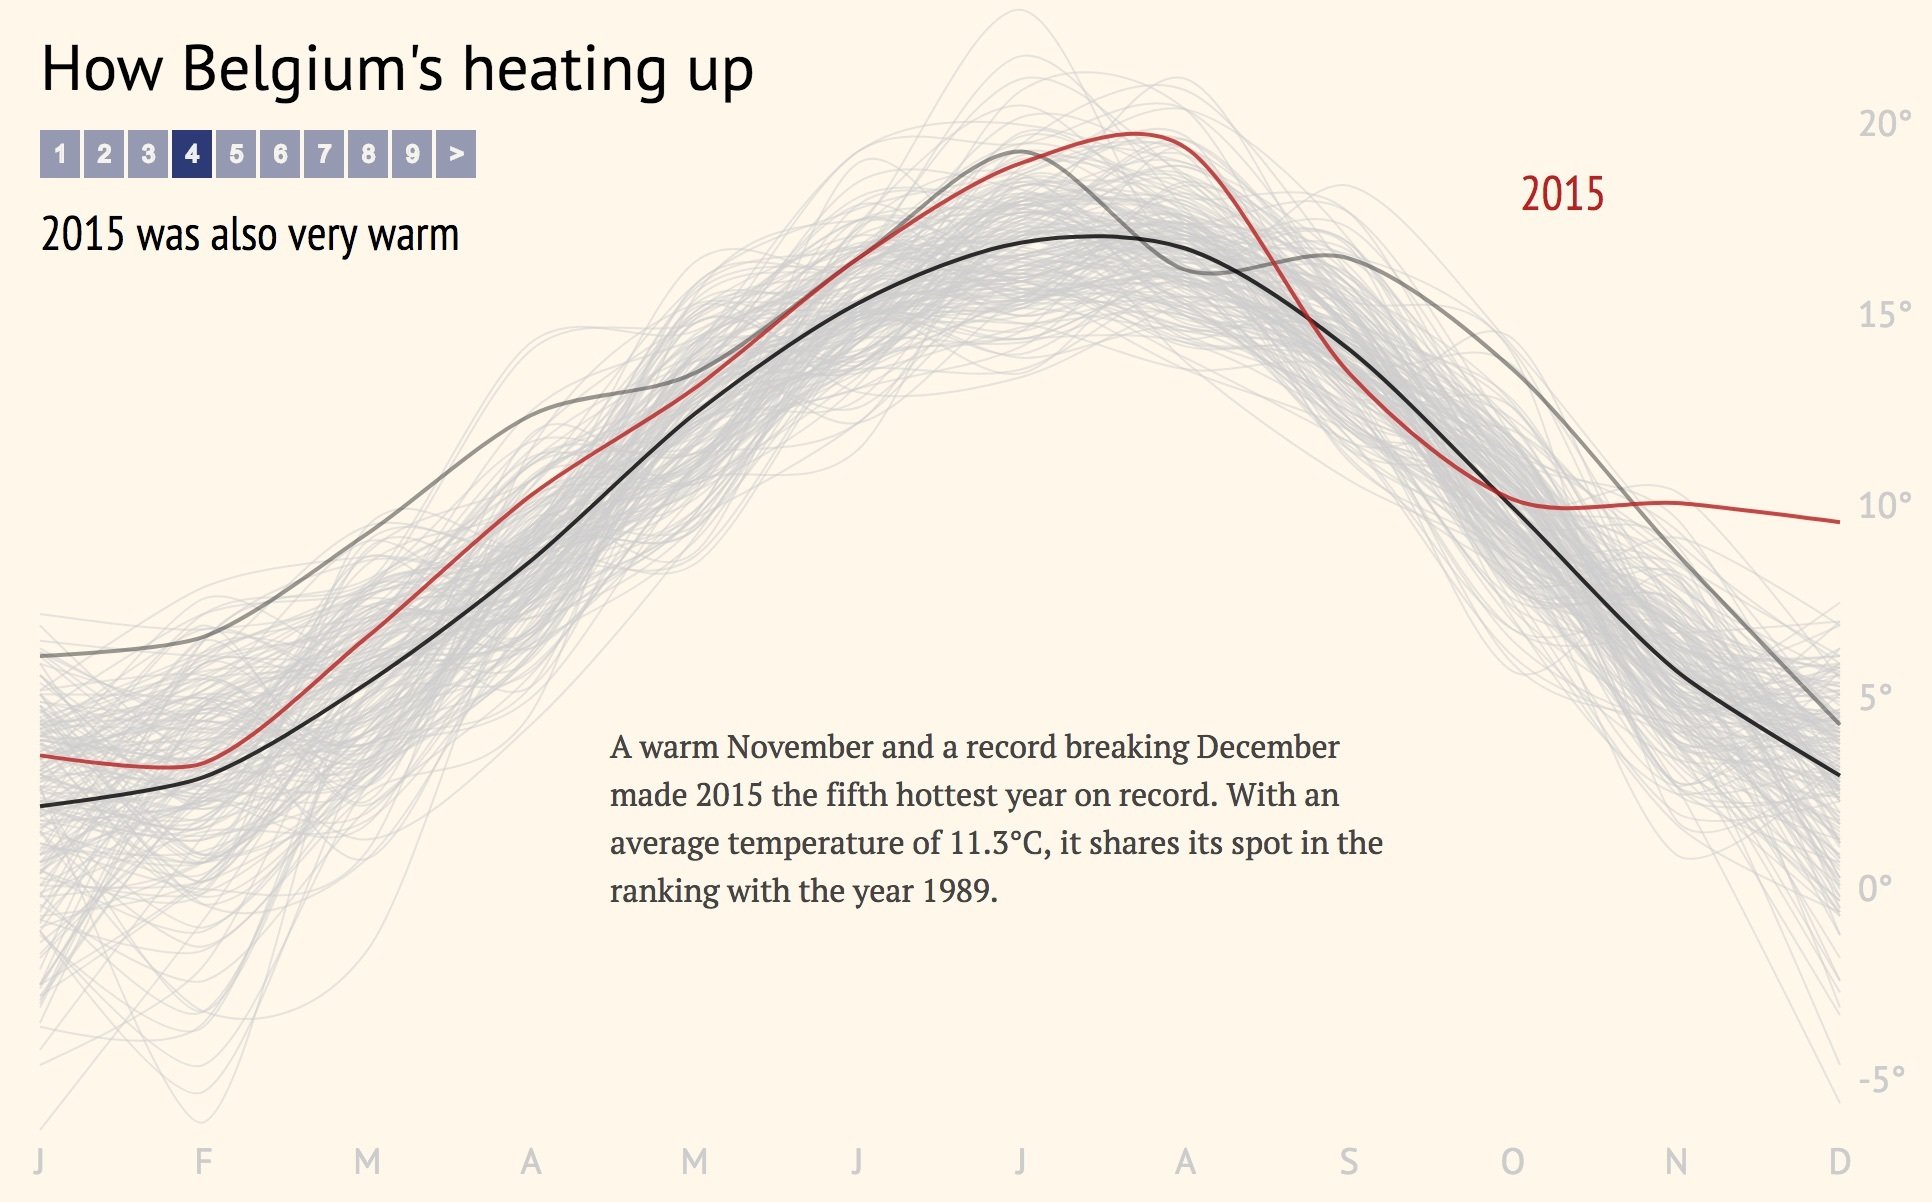
Winter 2014
setwd("~/Sites/ukkel")
read.csv("ukkel_tt.csv", sep=";")
ukkel <- read.csv("ukkel_tt.csv", sep=";")
head(ukkel)
colnames(ukkel) <- c("Jaar","1","2","3","4","5","6","7","8","9","10","11","12")
head(ukkel)
melt <- melt(ukkel, id=c("Jaar"))
library("reshape2", lib.loc="/Library/Frameworks/R.framework/Versions/3.1/Resources/library")
melt <- melt(ukkel, id=c("Jaar"))
head(melt)
colnames(melt) <- c("Jaar", "Maand", "T")
head(melt)
write.csv(melt, "temperature2.csv")
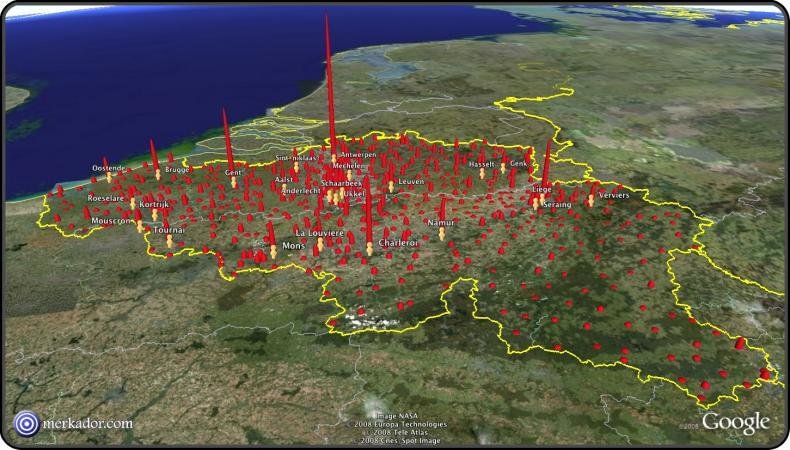
Toolbuilding:
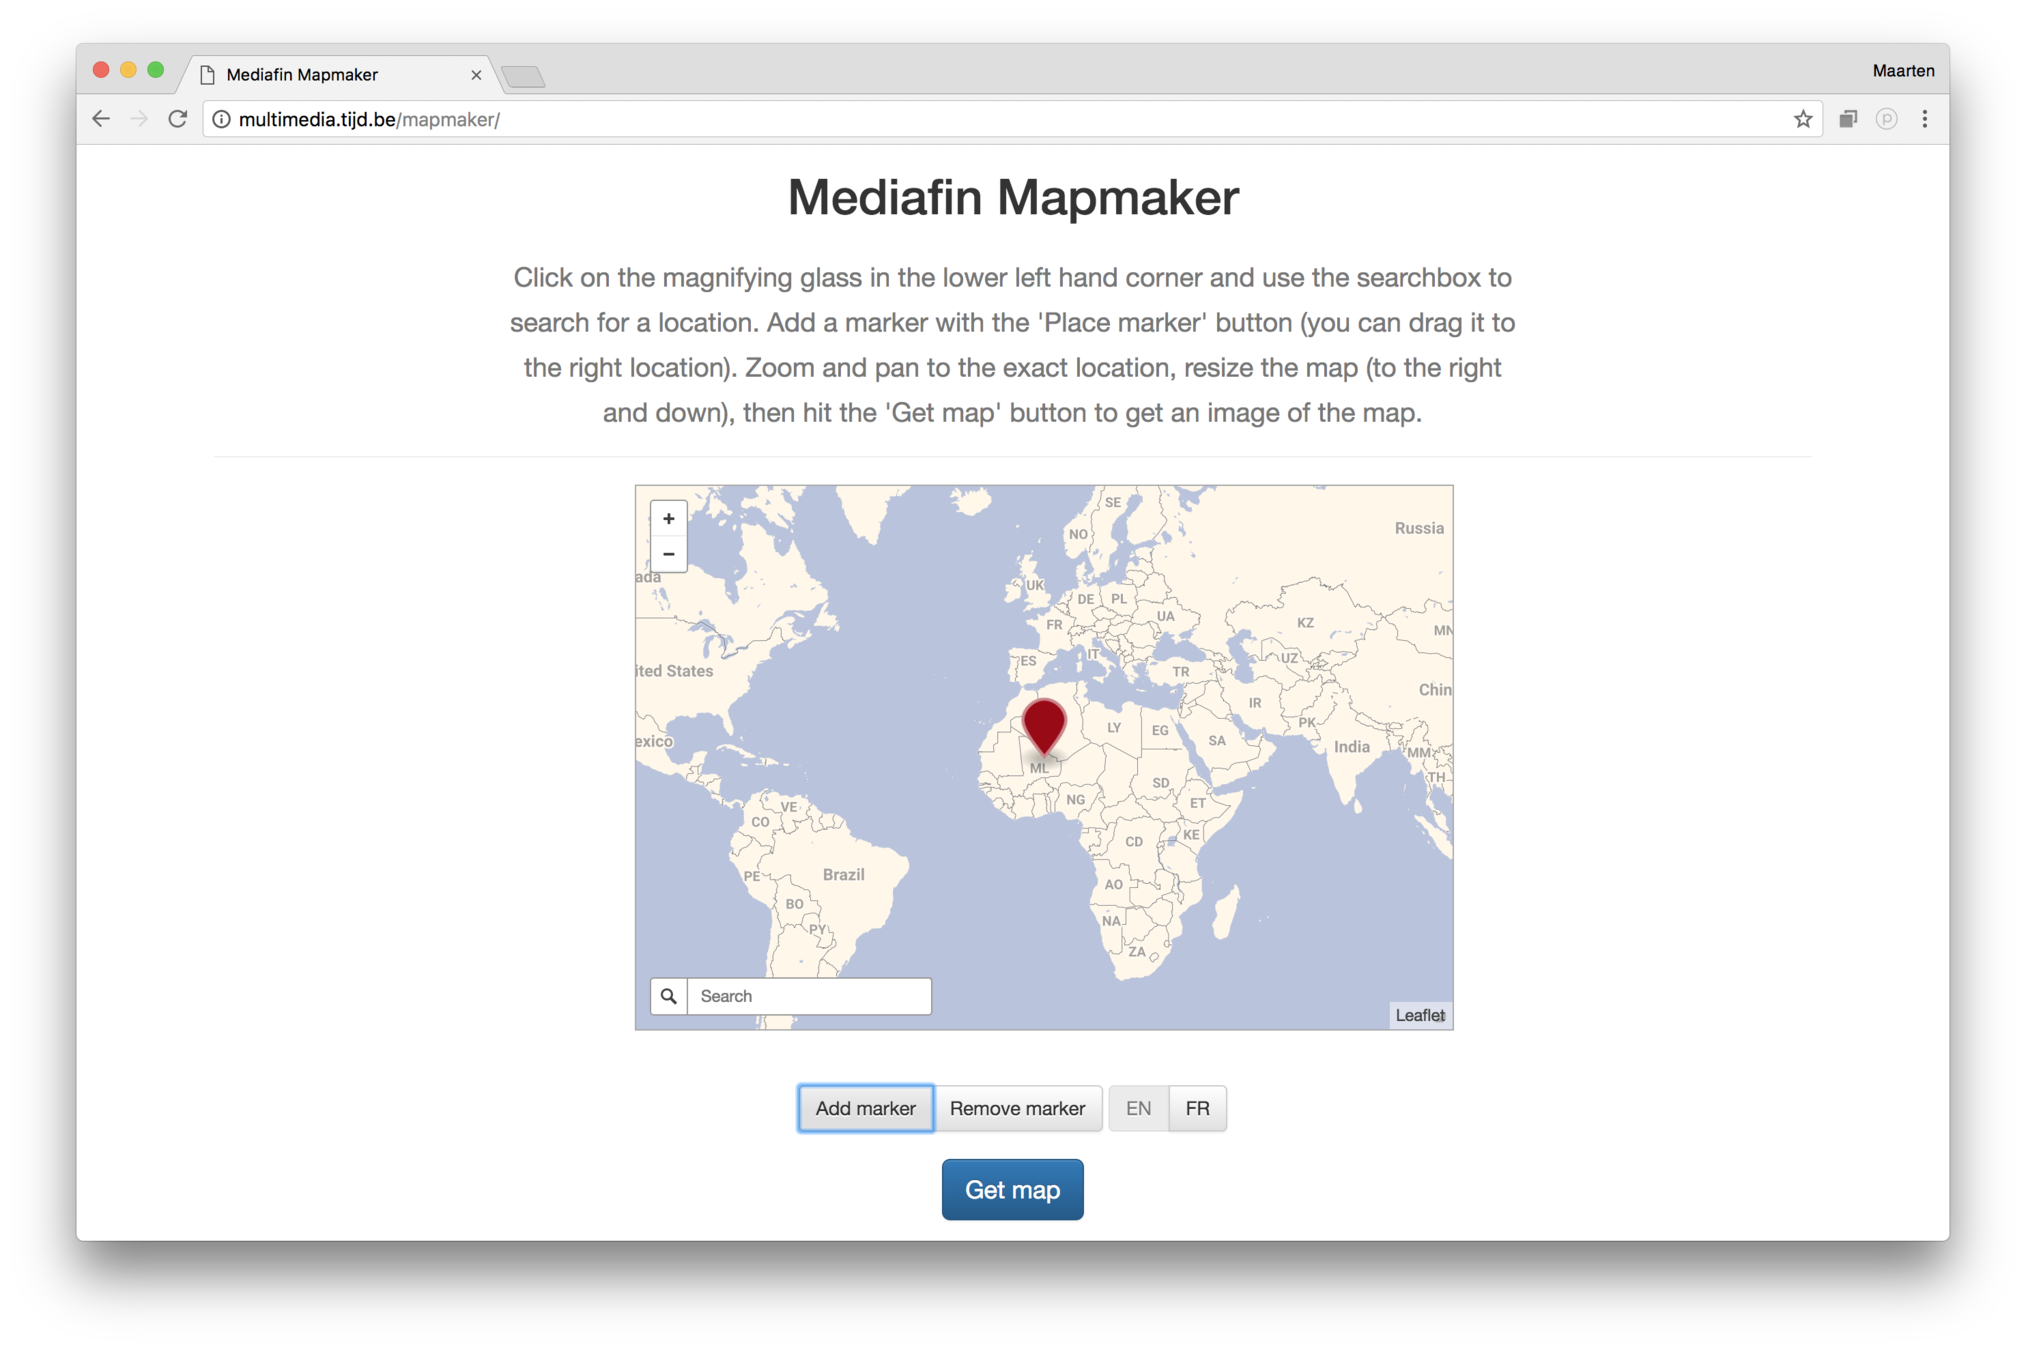
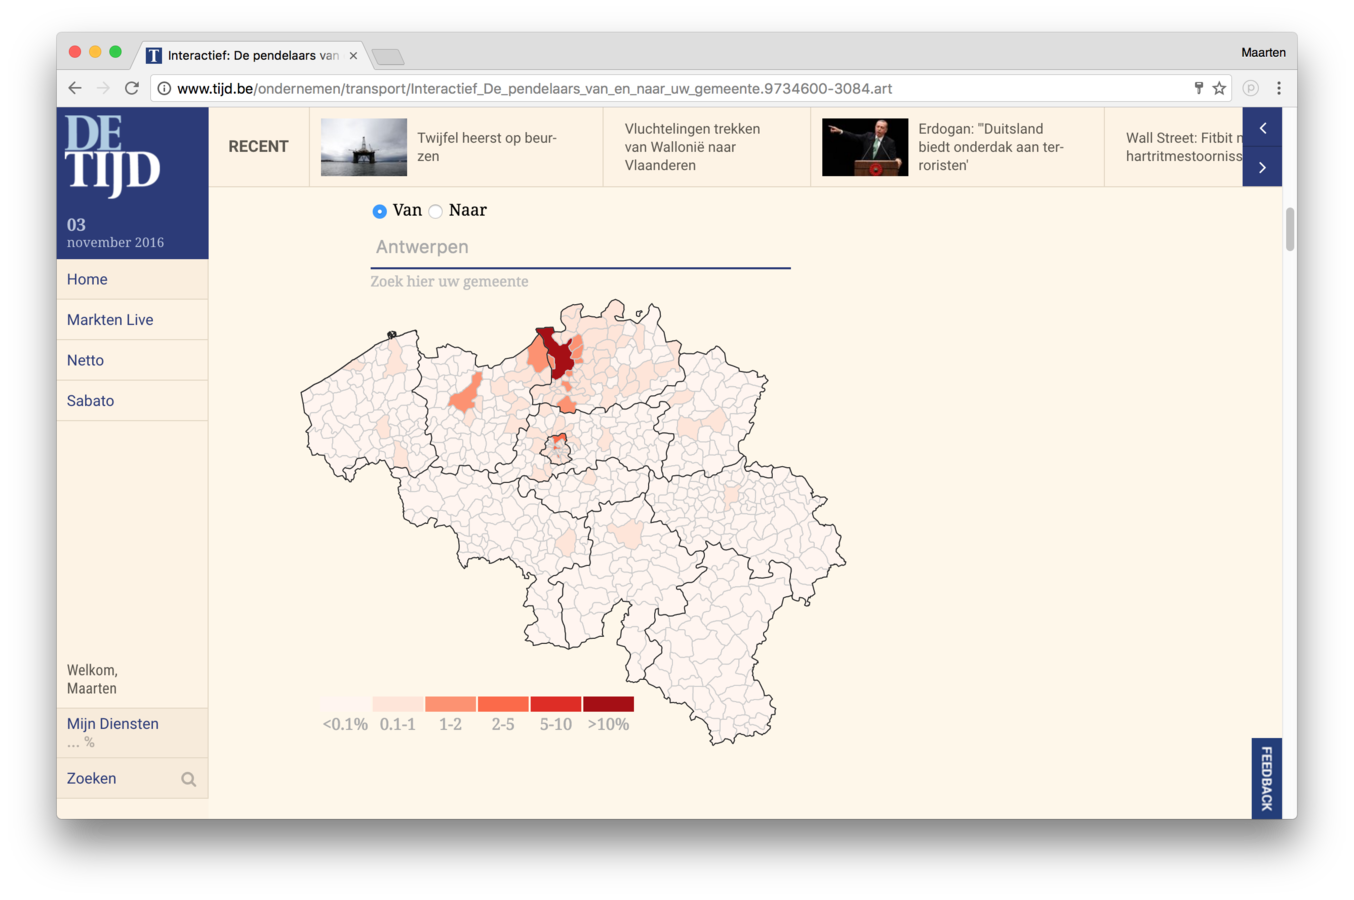
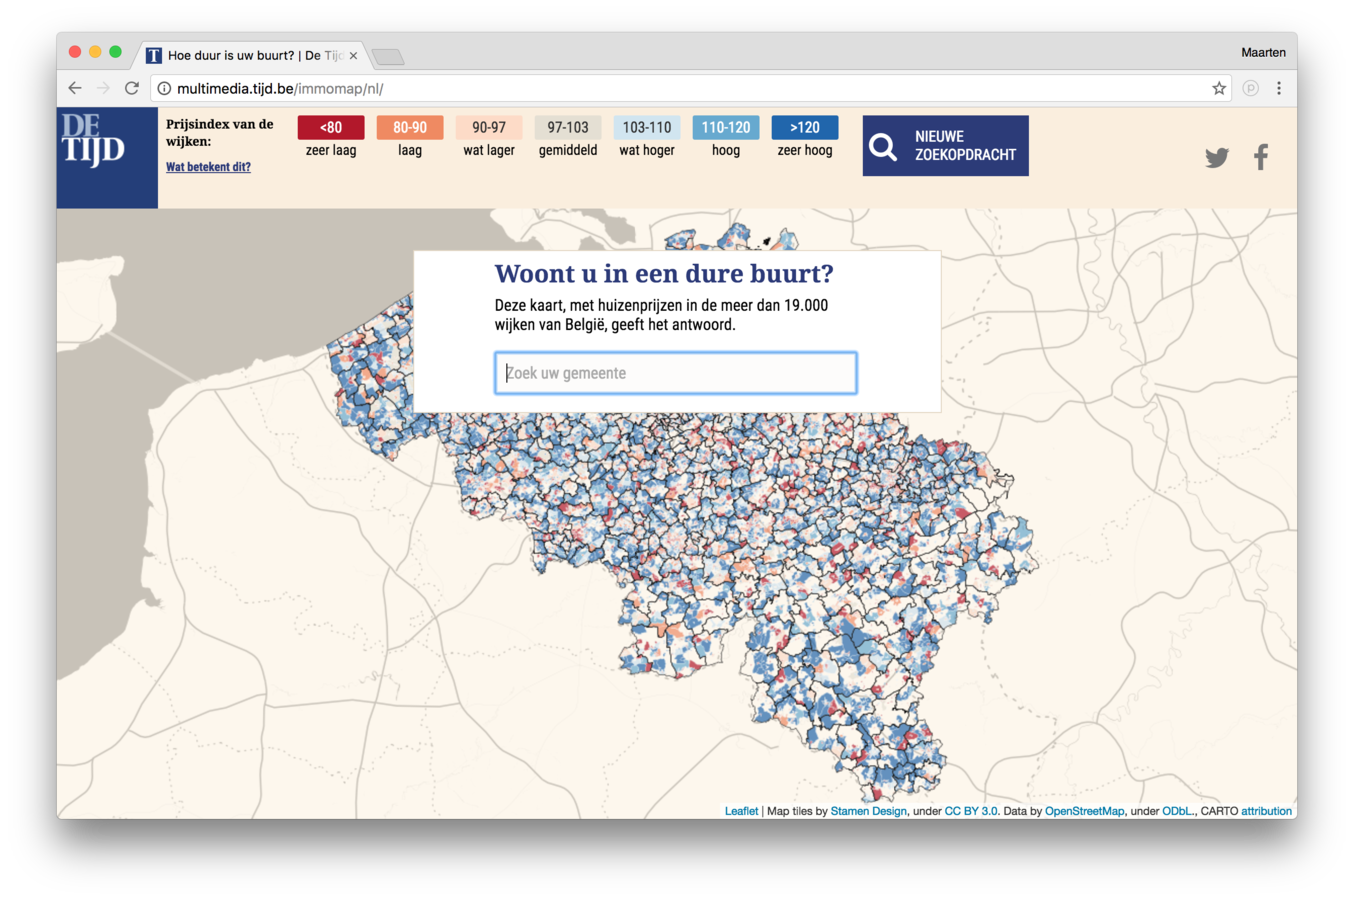
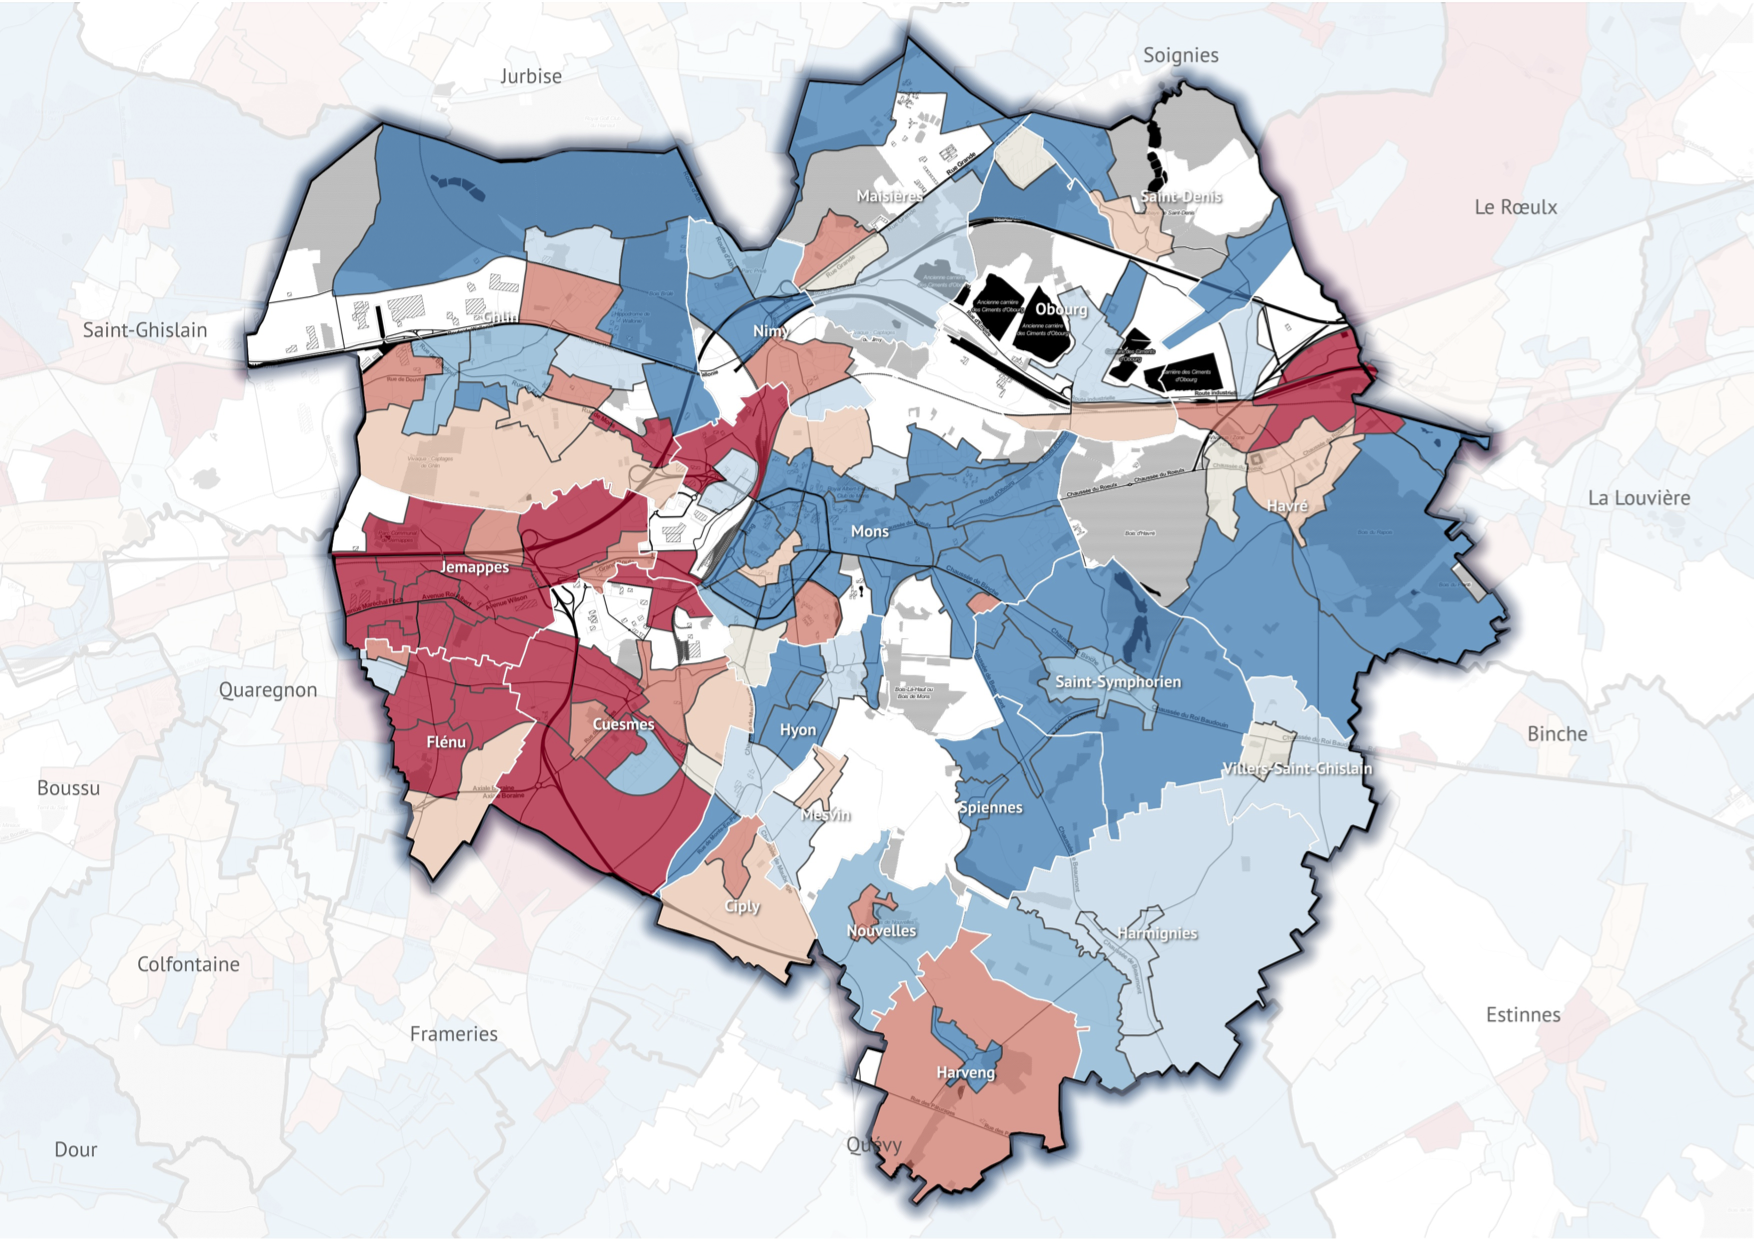
Mapmaker
Mapbox

library(rvest)

vlaverturl <- "https://www.vlaamsparlement.be/vlaamse-volksvertegenwoordigers"
vlaverthtml <- read_html(vlaverturl)

##Get the names, parties and the urls of the profile pages
vlavert <- vlaverthtml %>% html_nodes(".field--name-volledige-naam") %>% html_text()

vlapart <- vlaverthtml %>% html_nodes(".field--name-huidigefractie") %>% html_text()

vlaverturls <- vlaverthtml %>% html_nodes("span a") %>% html_attr("href")
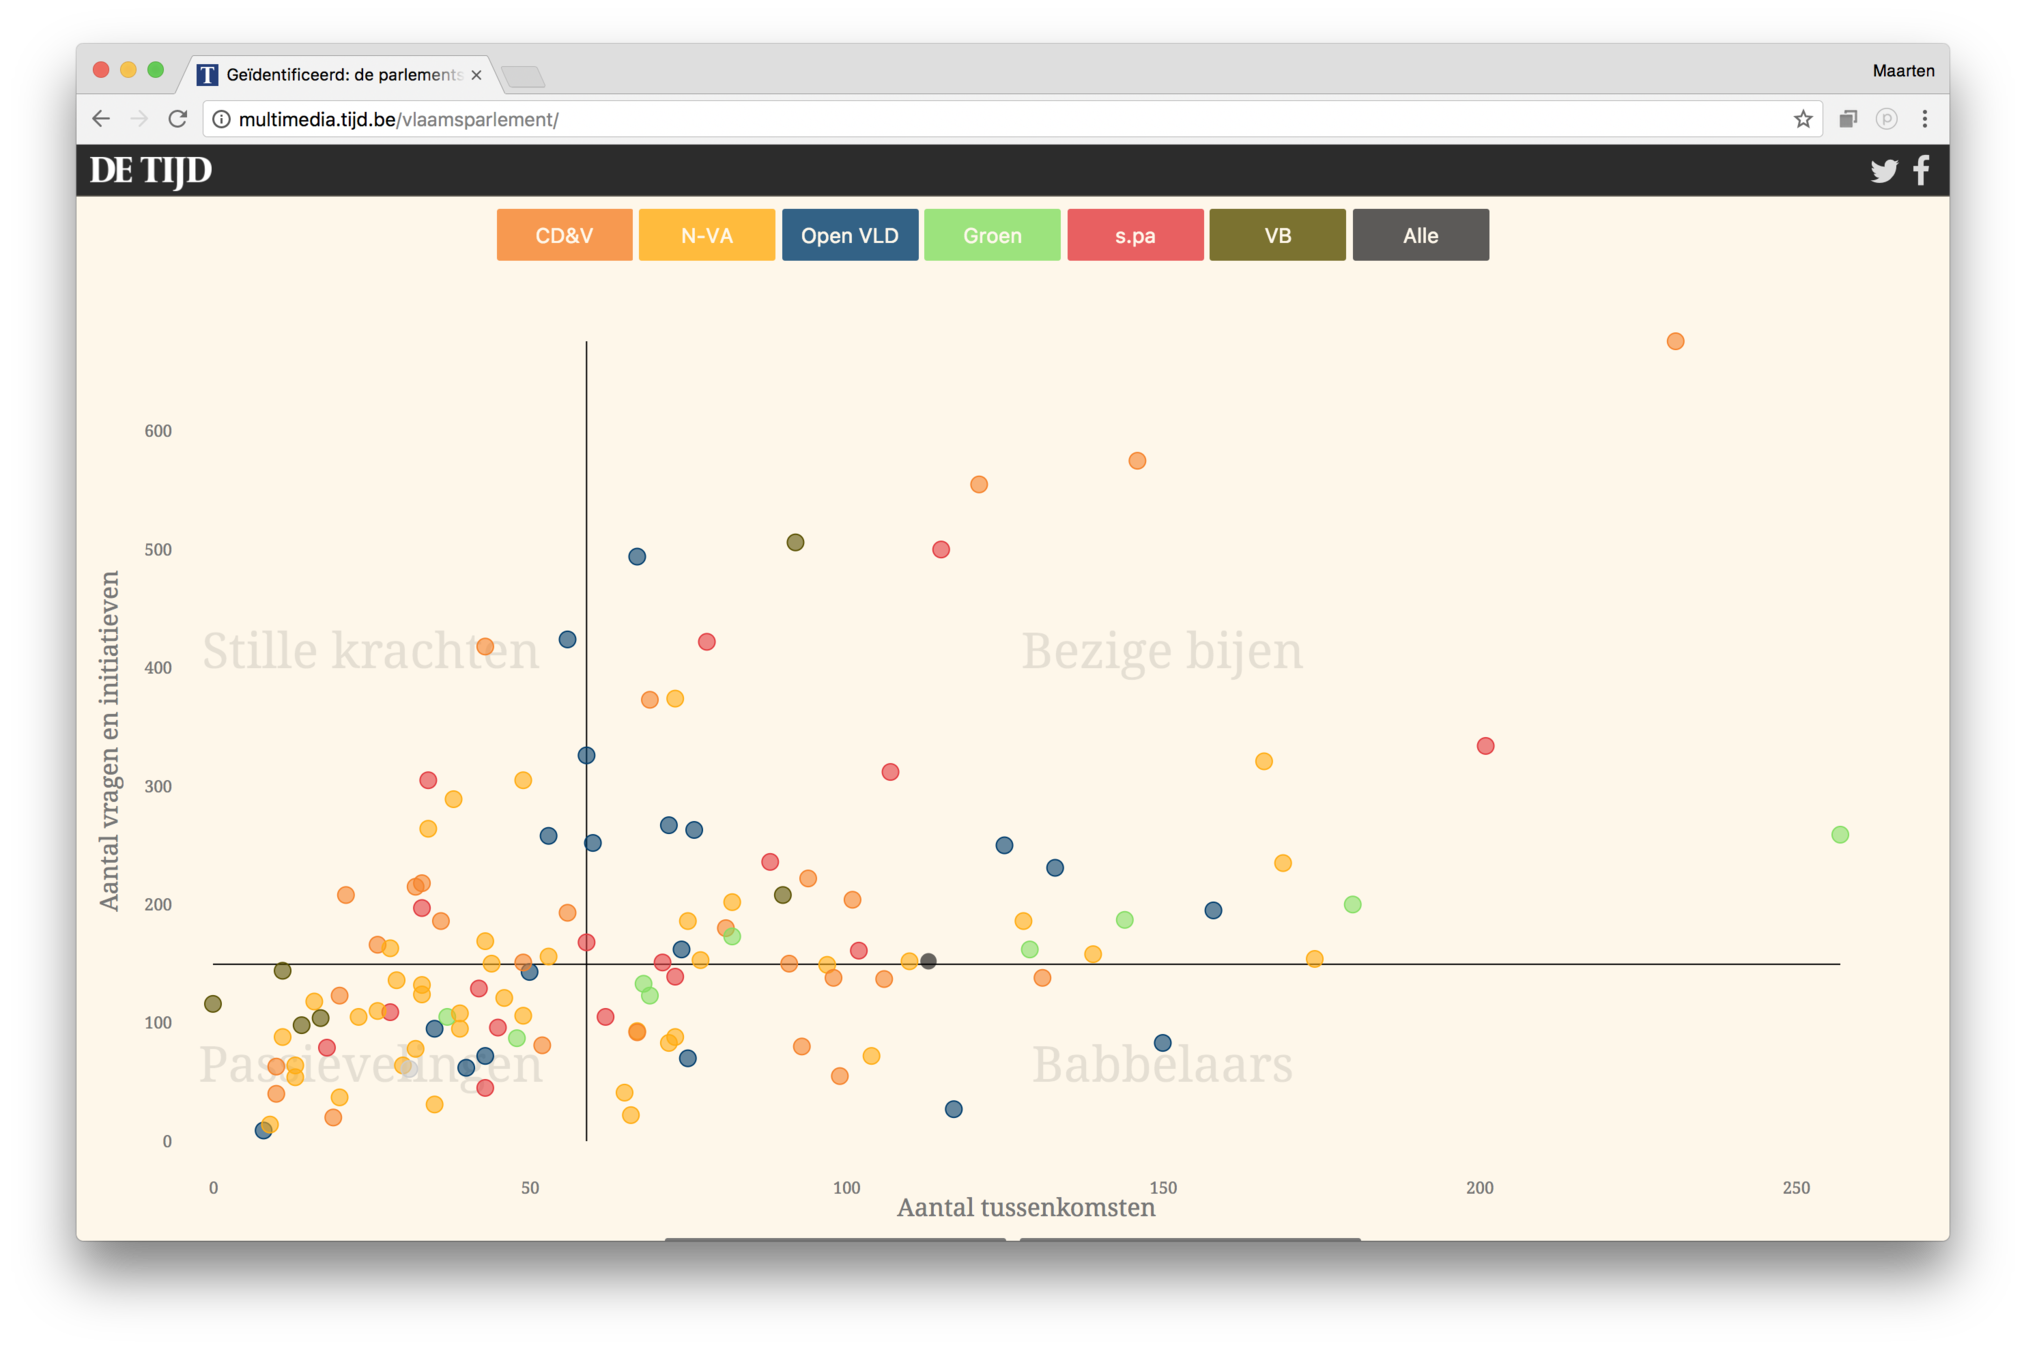
package(ggplot2)

scatter <- ggplot(finaldata, aes(x = tussenkomsten, y = vrageninitiatieven, col = partij)) +
  geom_point(alpha = 0.7, size = 3) +
  geom_text(aes(label = achternaam), nudge_y = 10) +
  scale_colour_manual(values = c("#83de62","#ffac12", "#003d6d", "#f5822a", "#e23a3f", "#5a5101", "#000000", "#cccccc")) +
  labs(x = "Aantal tussenkomsten", y = "Aantal vragen en initiatieven") +
  theme_minimal() +
  theme(legend.position="none") +
  geom_hline(aes(yintercept=median.vrageninitiatieven)) +
  geom_vline(aes(xintercept=median.tussenkomsten))
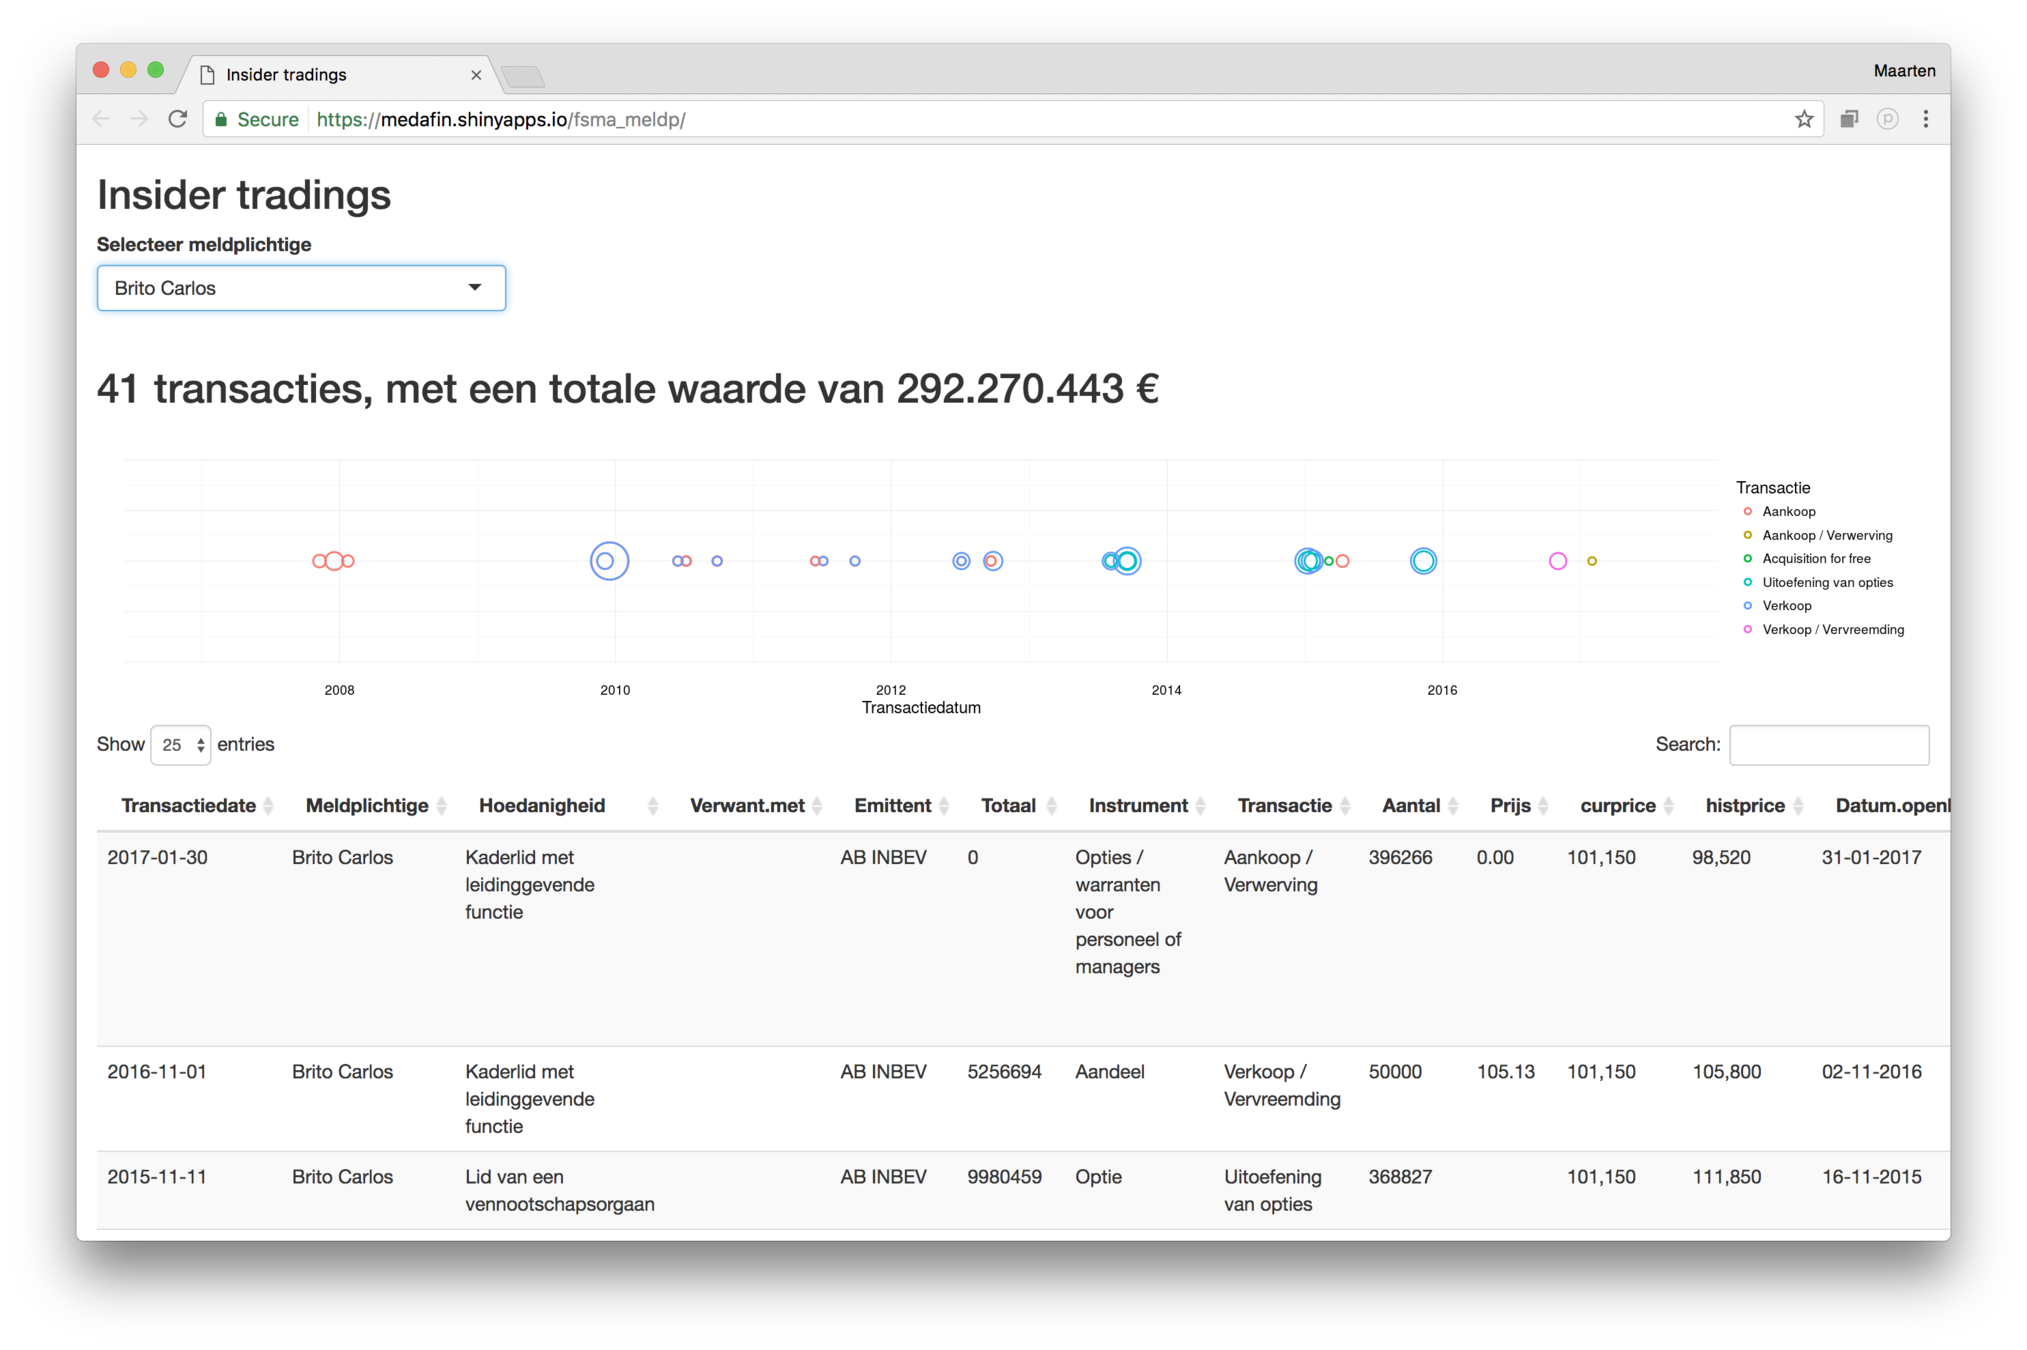
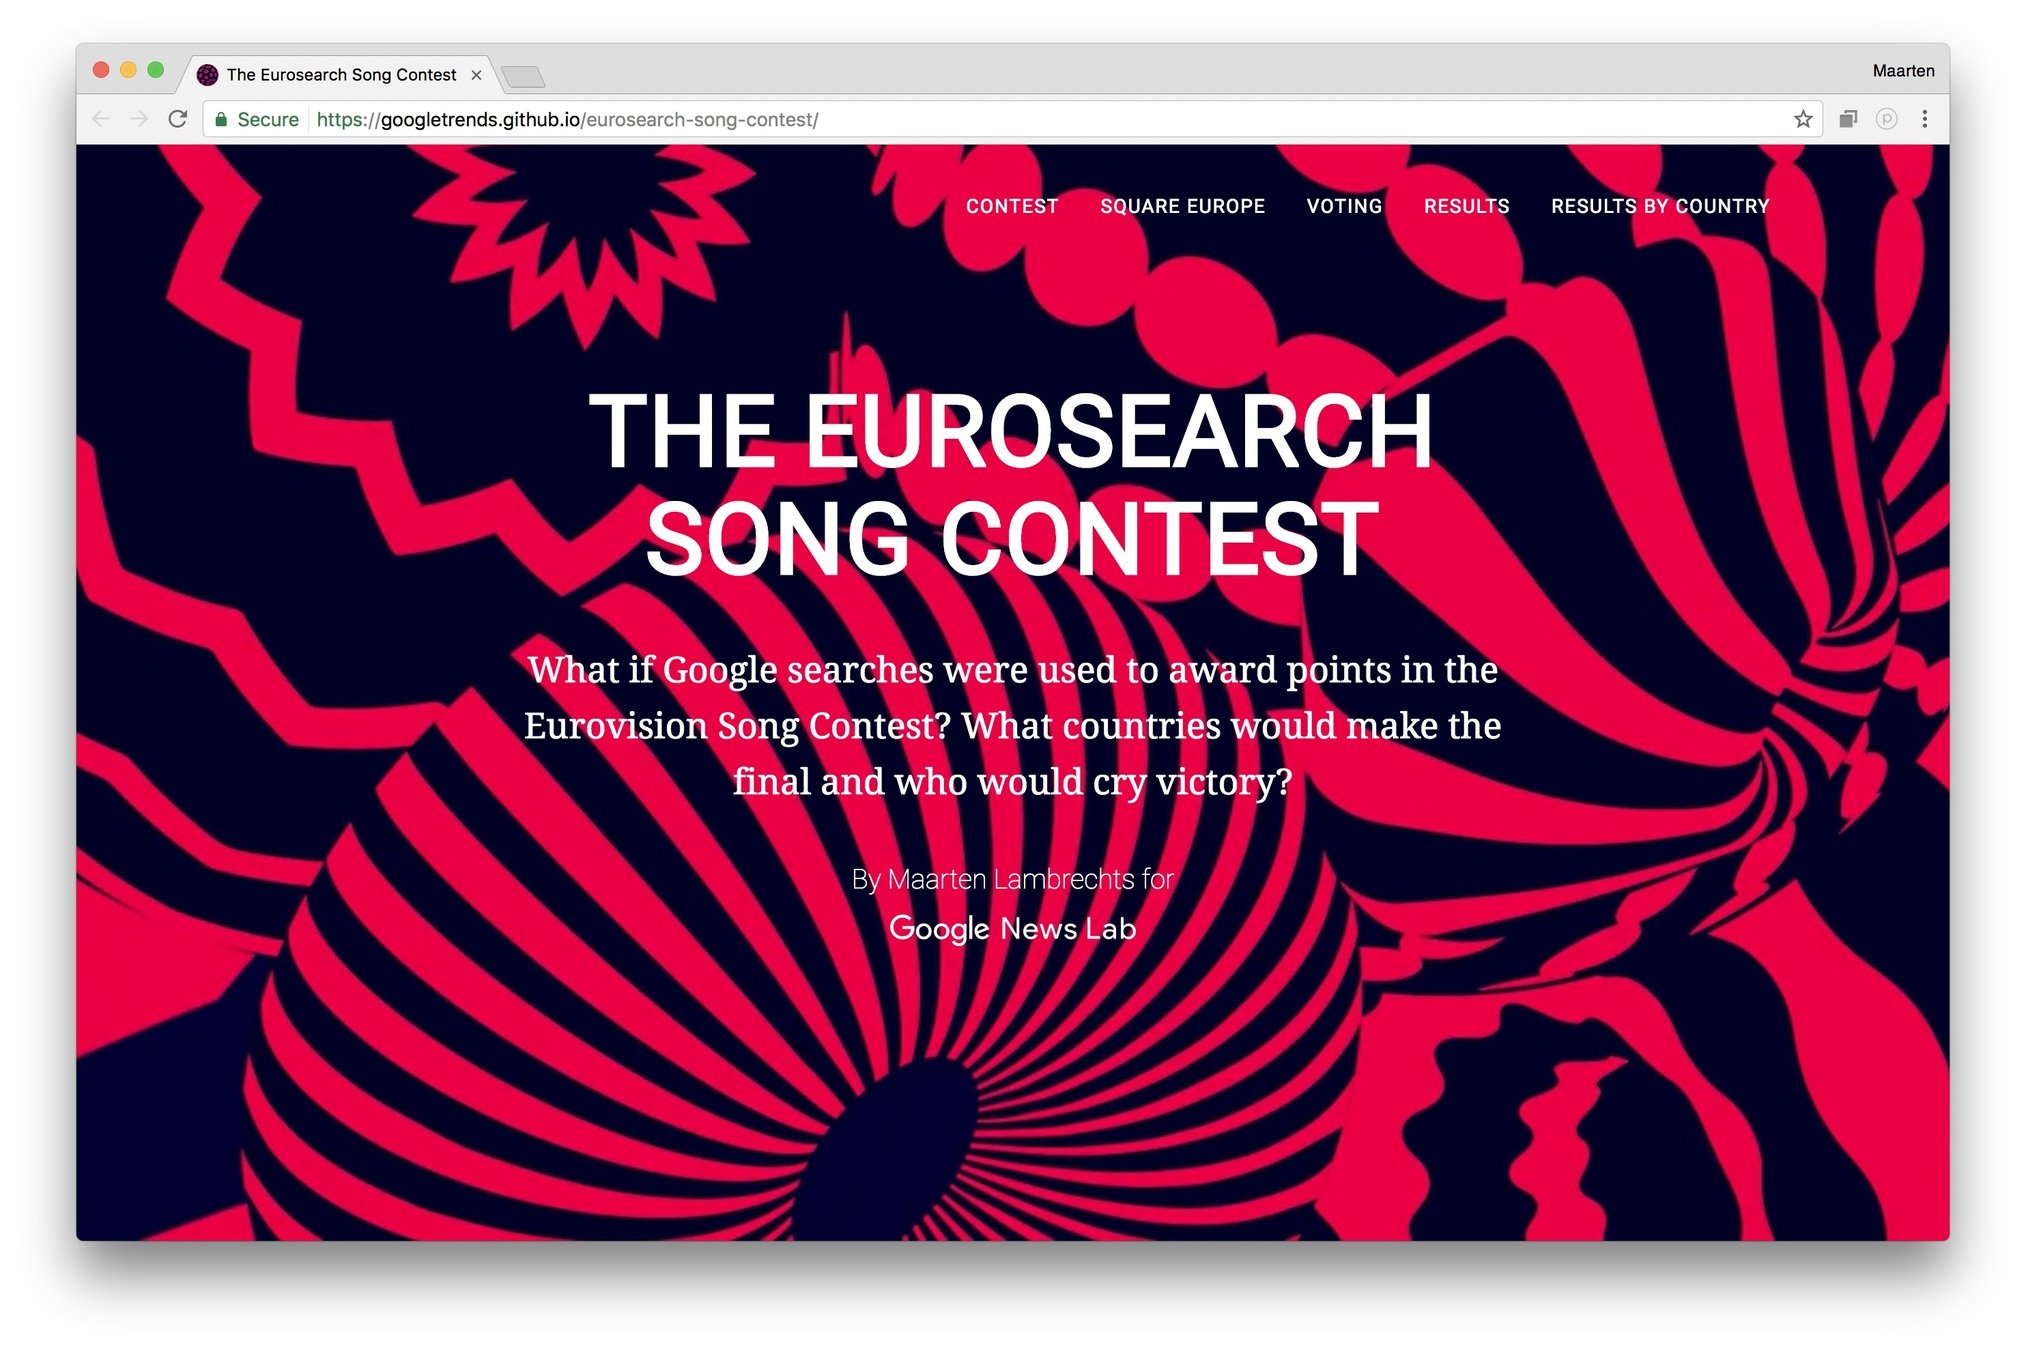
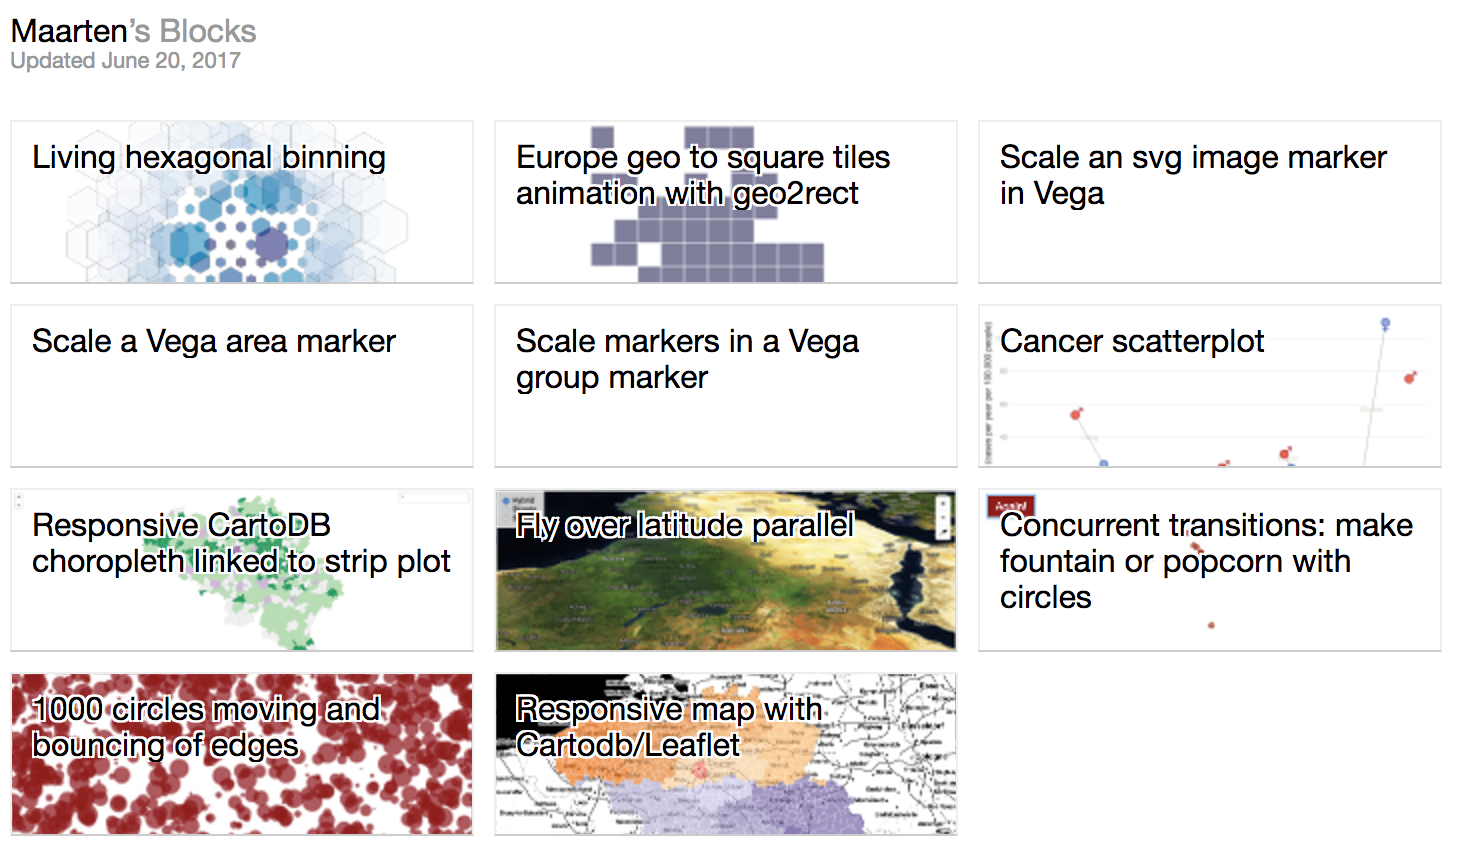
2015
2017
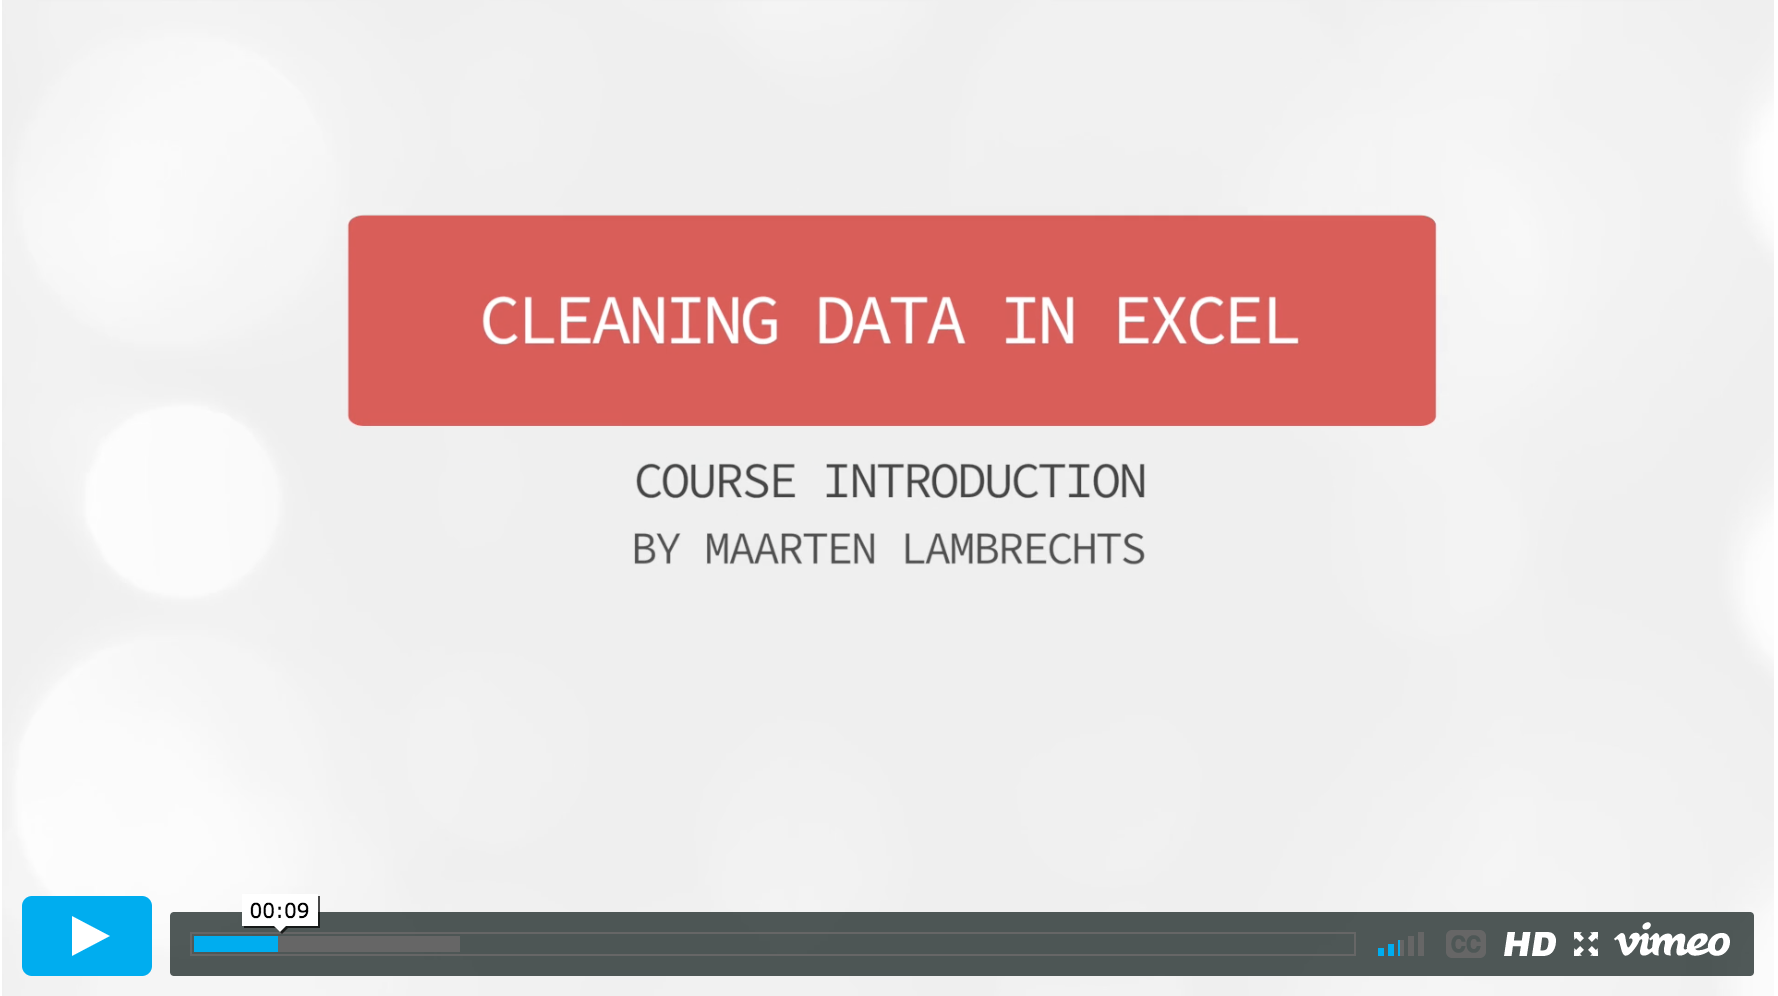
Freelancing

My lessons
- 'Journalist isn't a profession' - Alberto Cairo
- The rise of the journalist engineer - Matt Daniels from Polygraph
- Journalistic skills help everywhere
- Web skills always help
- Put your things out there
- Tweet
- Get inspired and run with ideas
- Don't learn all the tools, but know what they can do
- Learn the rules of good dataviz, so you can break them
- Just *do* dataviz
Thanks!
www.maartenlambrechts.com
@maartenzam
Big Dive
By maartenzam


