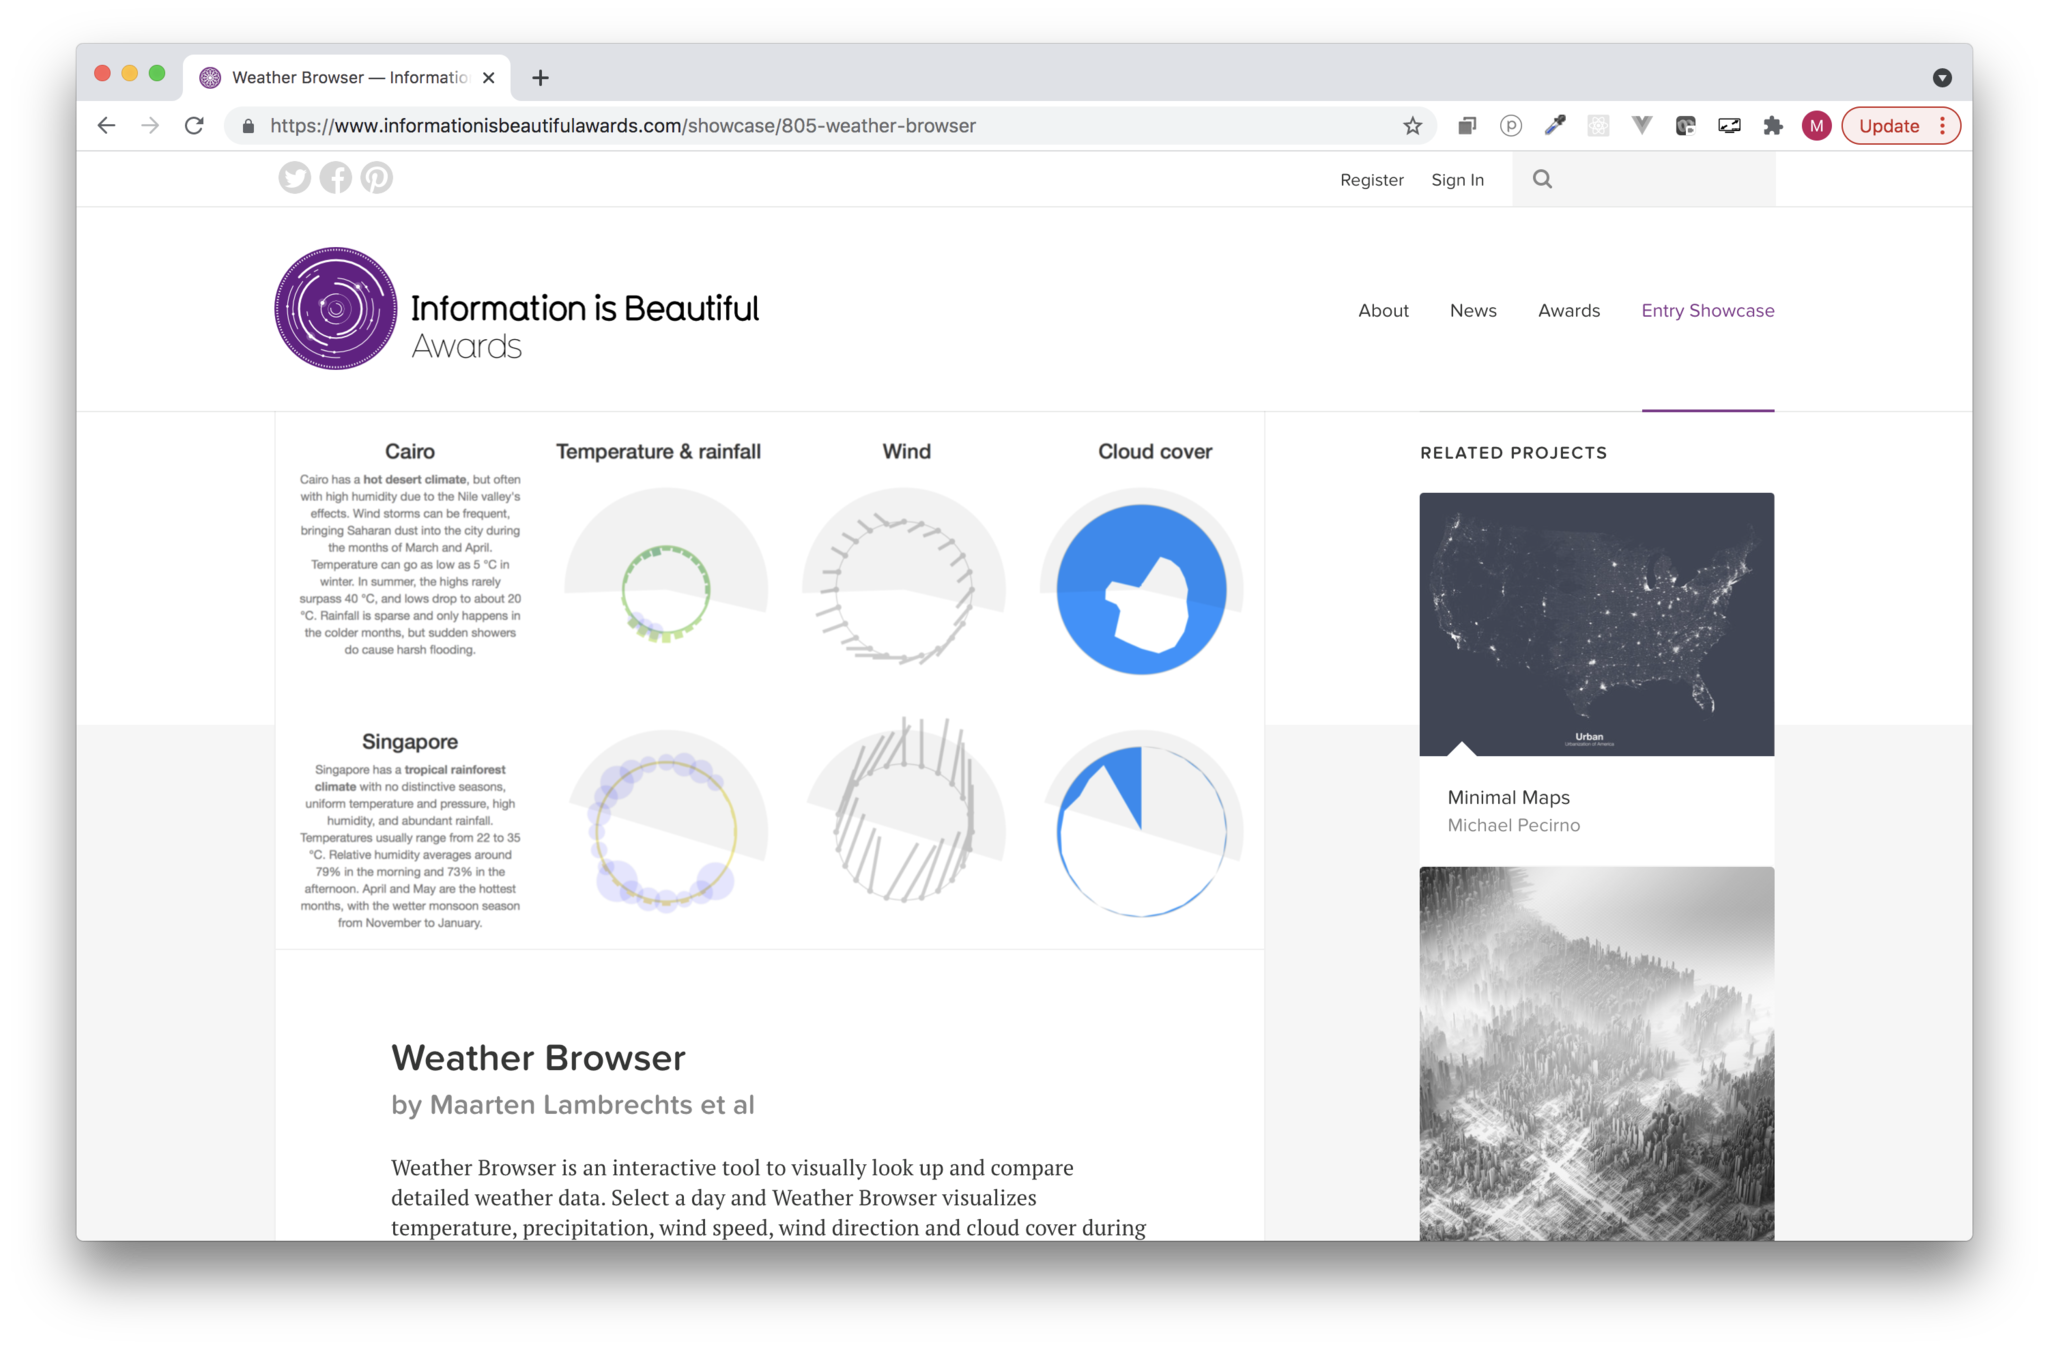
A 15 year journey through dataviz on the web
Maarten Lambrechts
From d3 v2 to svelte
CIMAT
INEGI
12 November 2021
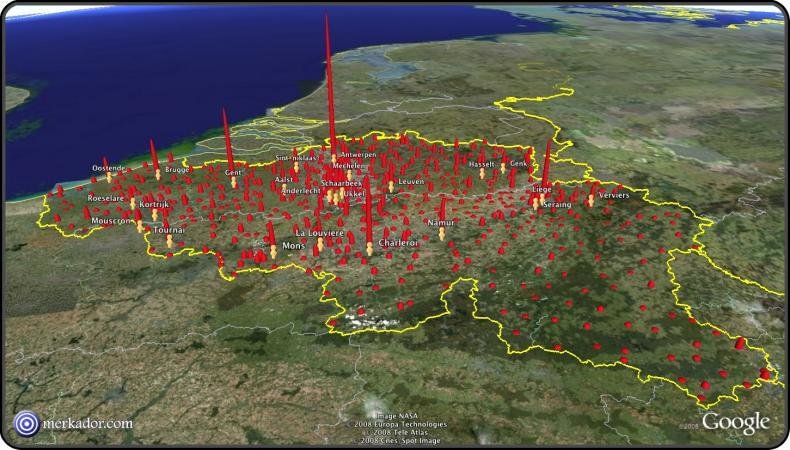
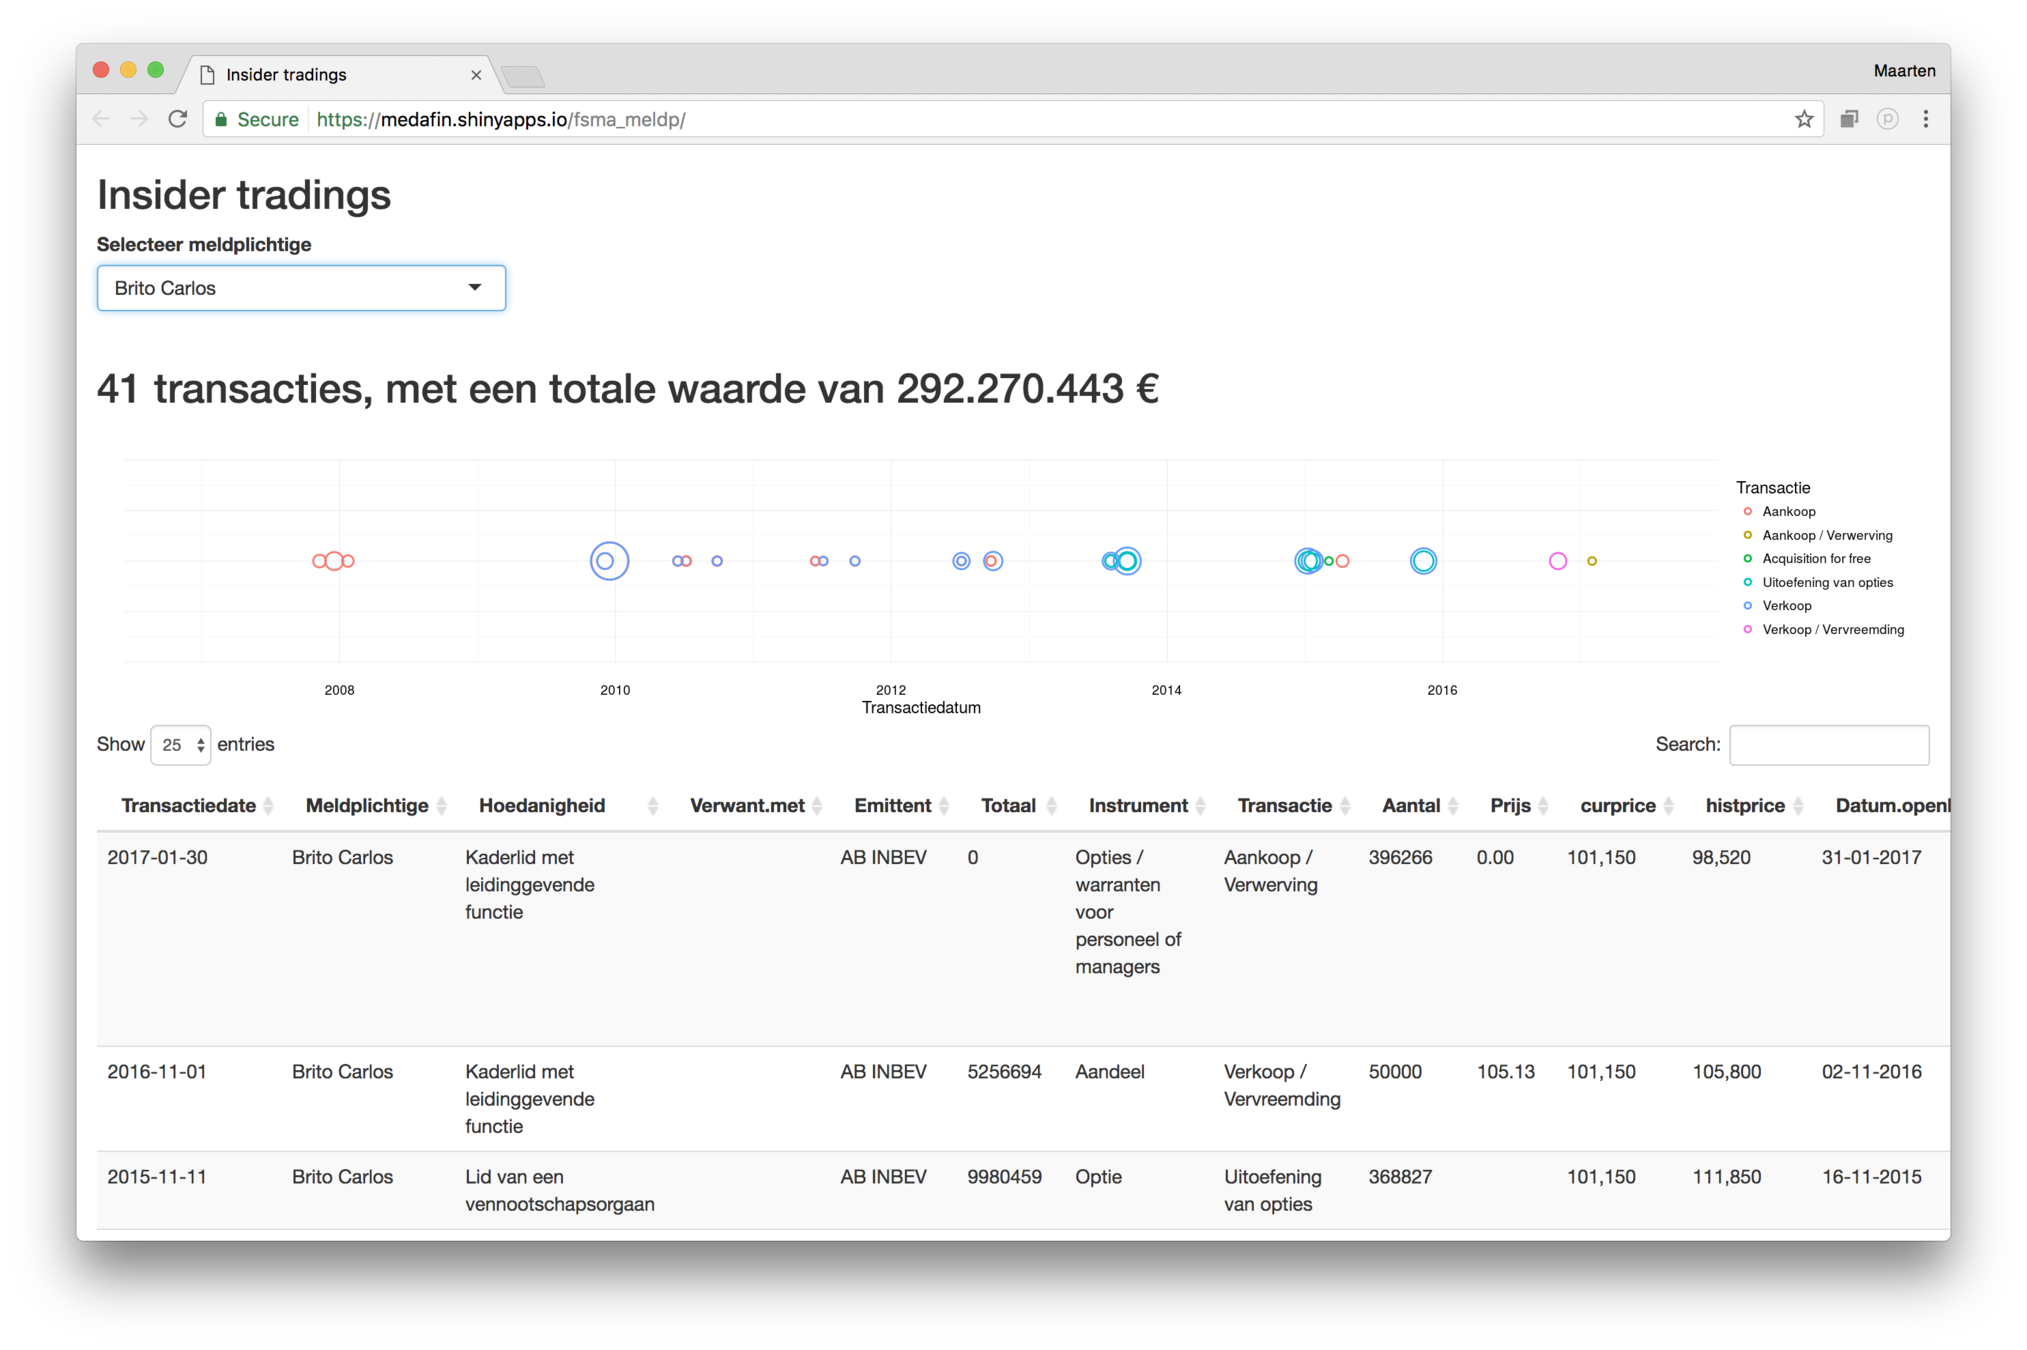
2006


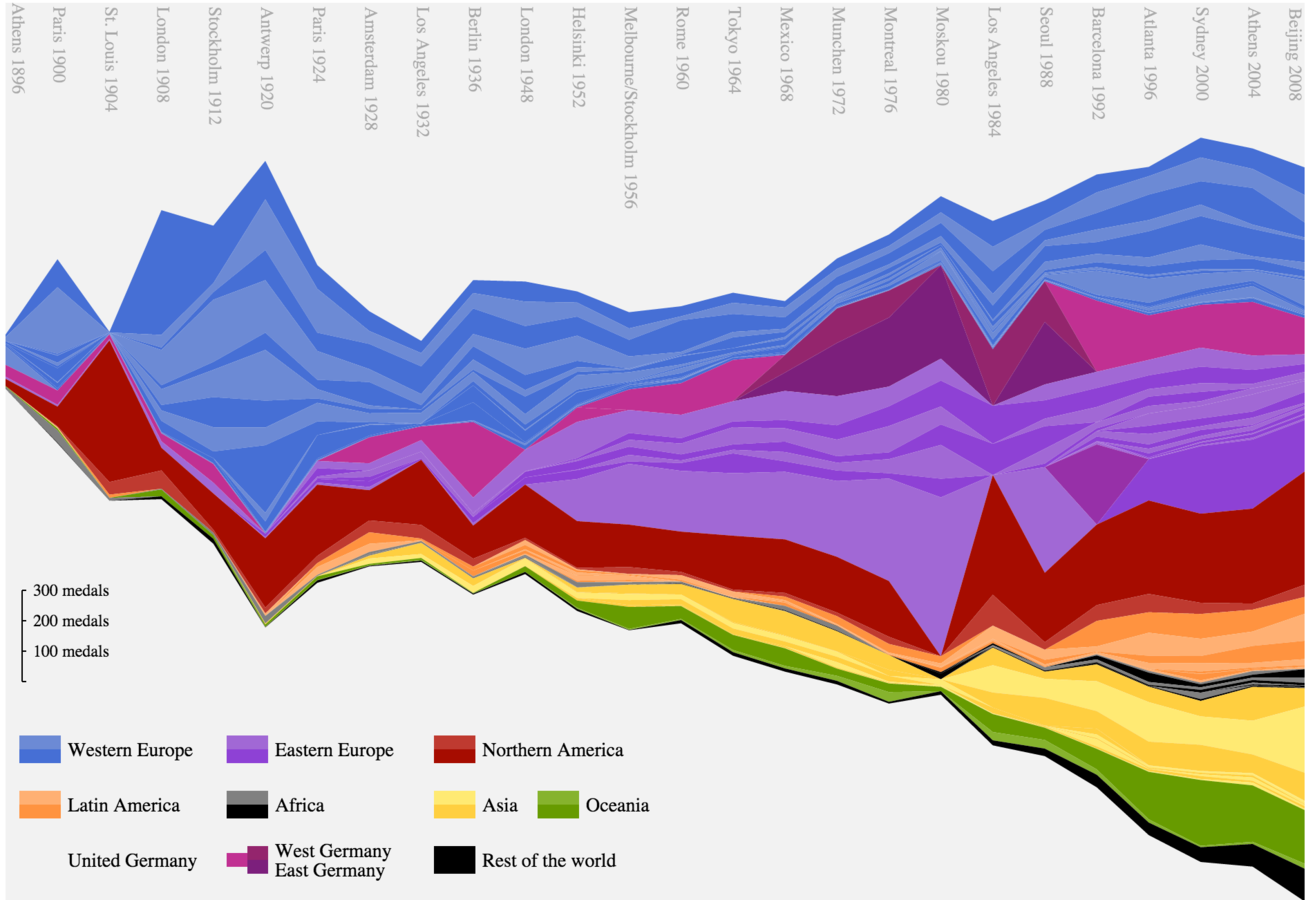
2011

<!DOCTYPE html>
<html>

<head>
    <script src="https://d3js.org/d3.min.js"></script>
</head>

<body>
    <svg id="viz">
    	// Let D3 add stuff here, and do things with it
    </svg>
</body>
<script>
    // Load data with D3
    d3.csv(...)
    // Transform data with D3
    var xScale = d3.scaleLinear()...
    // Add and update elements with D3
    d3.select("#viz").selectAll("circle")
    	.data(data)
    	.enter()
        .append("circle")
        ...
</script>

</html>
D3.js for everything
| country | income | life expectancy |
|---|
Html
svg chart
D3
| country | income | life expectancy |
|---|
Html
svg chart
D3
d3.scaleLog()
d3.scaleLinear()
Use D3 functions to calculate positions, size, ... of visual elements
Import the D3 library
| country | income | life expectancy |
|---|
Html
svg chart
D3
d3.scaleLog()
d3.scaleLinear()
Use D3 to add elements to the DOM
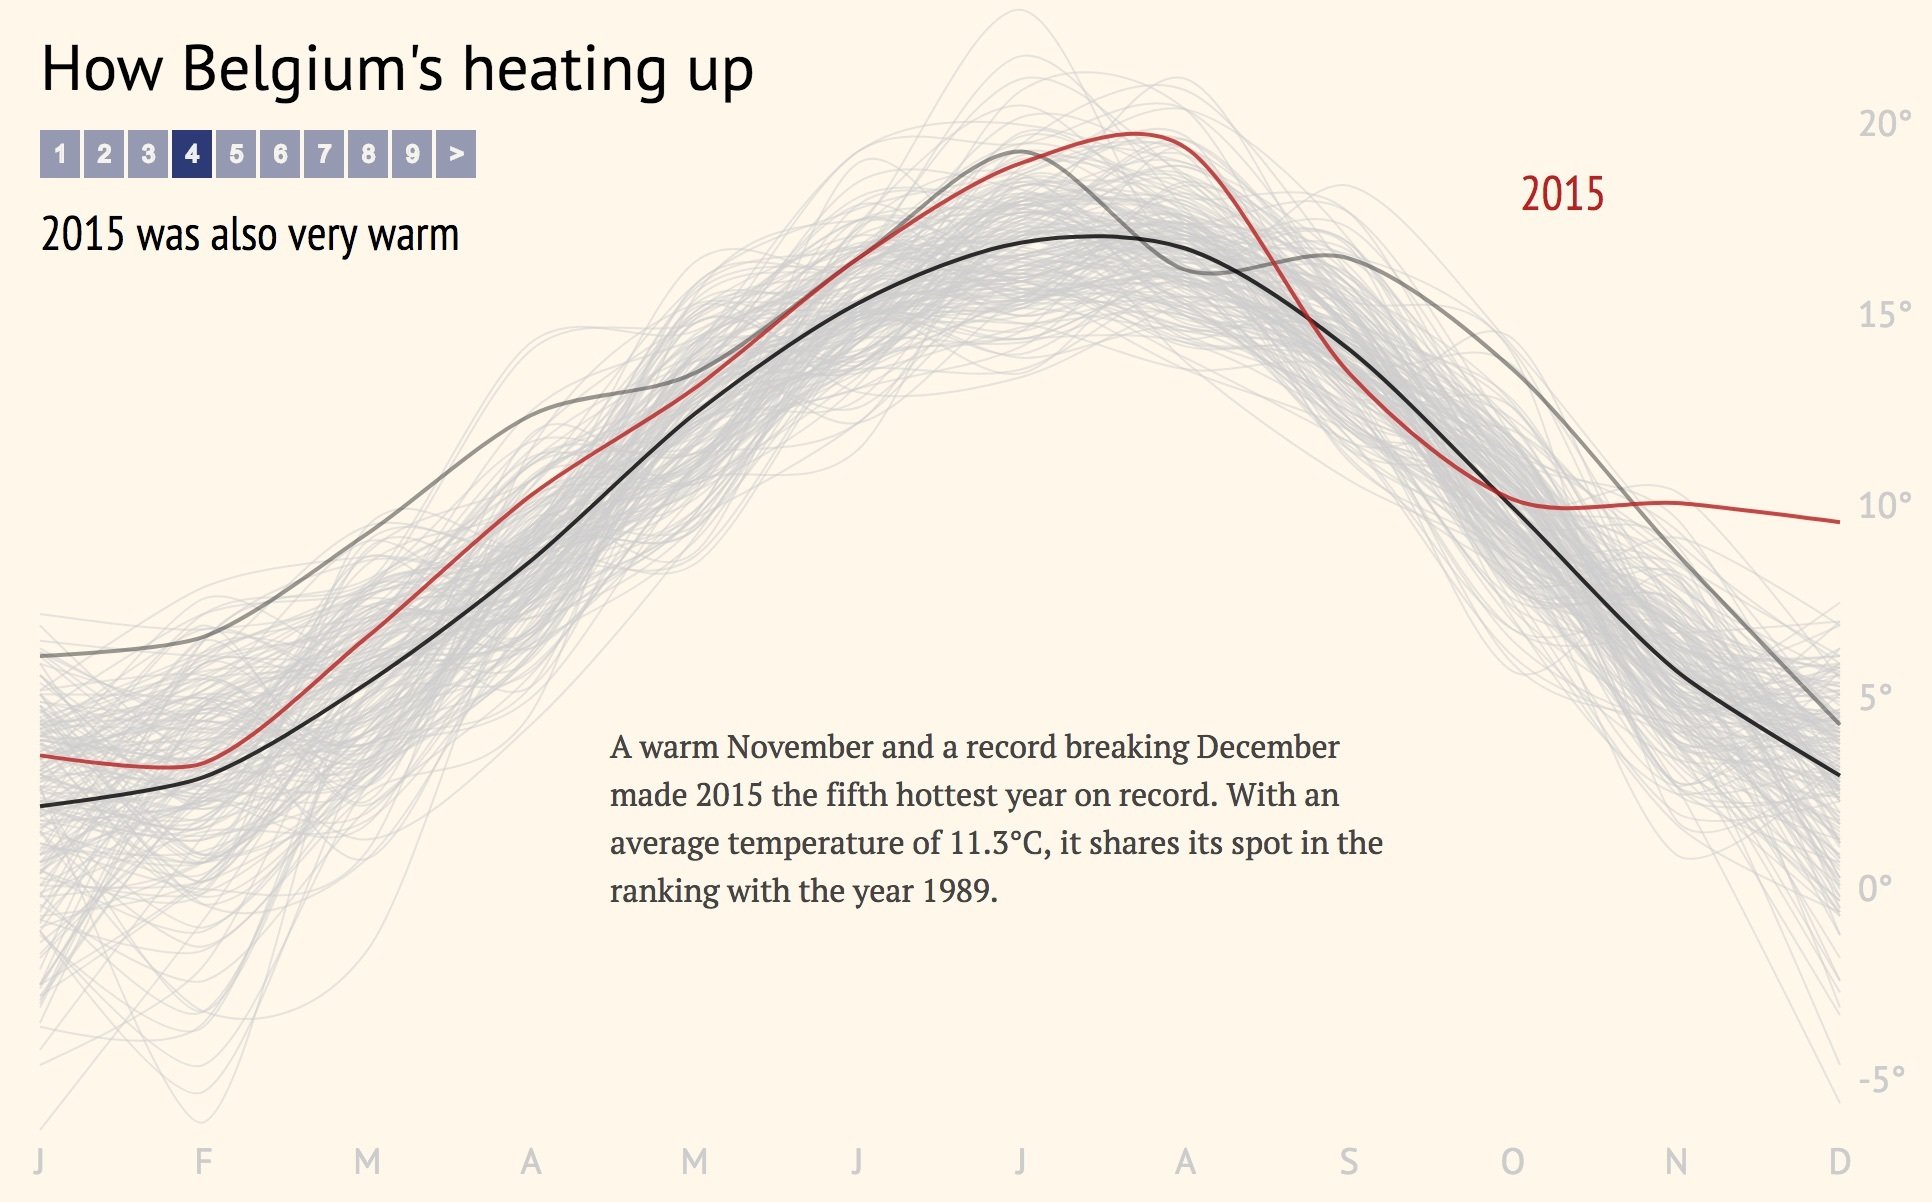
Summer 2014


Winter 2014
setwd("~/Sites/ukkel")
read.csv("ukkel_tt.csv", sep=";")
ukkel <- read.csv("ukkel_tt.csv", sep=";")
head(ukkel)
colnames(ukkel) <- c("Jaar","1","2","3","4","5","6","7","8","9","10","11","12")
head(ukkel)
melt <- melt(ukkel, id=c("Jaar"))
library("reshape2", lib.loc="/Library/Frameworks/R.framework/Versions/3.1/Resources/library")
melt <- melt(ukkel, id=c("Jaar"))
head(melt)
colnames(melt) <- c("Jaar", "Maand", "T")
head(melt)
write.csv(melt, "temperature2.csv")
+ the Tidyverse
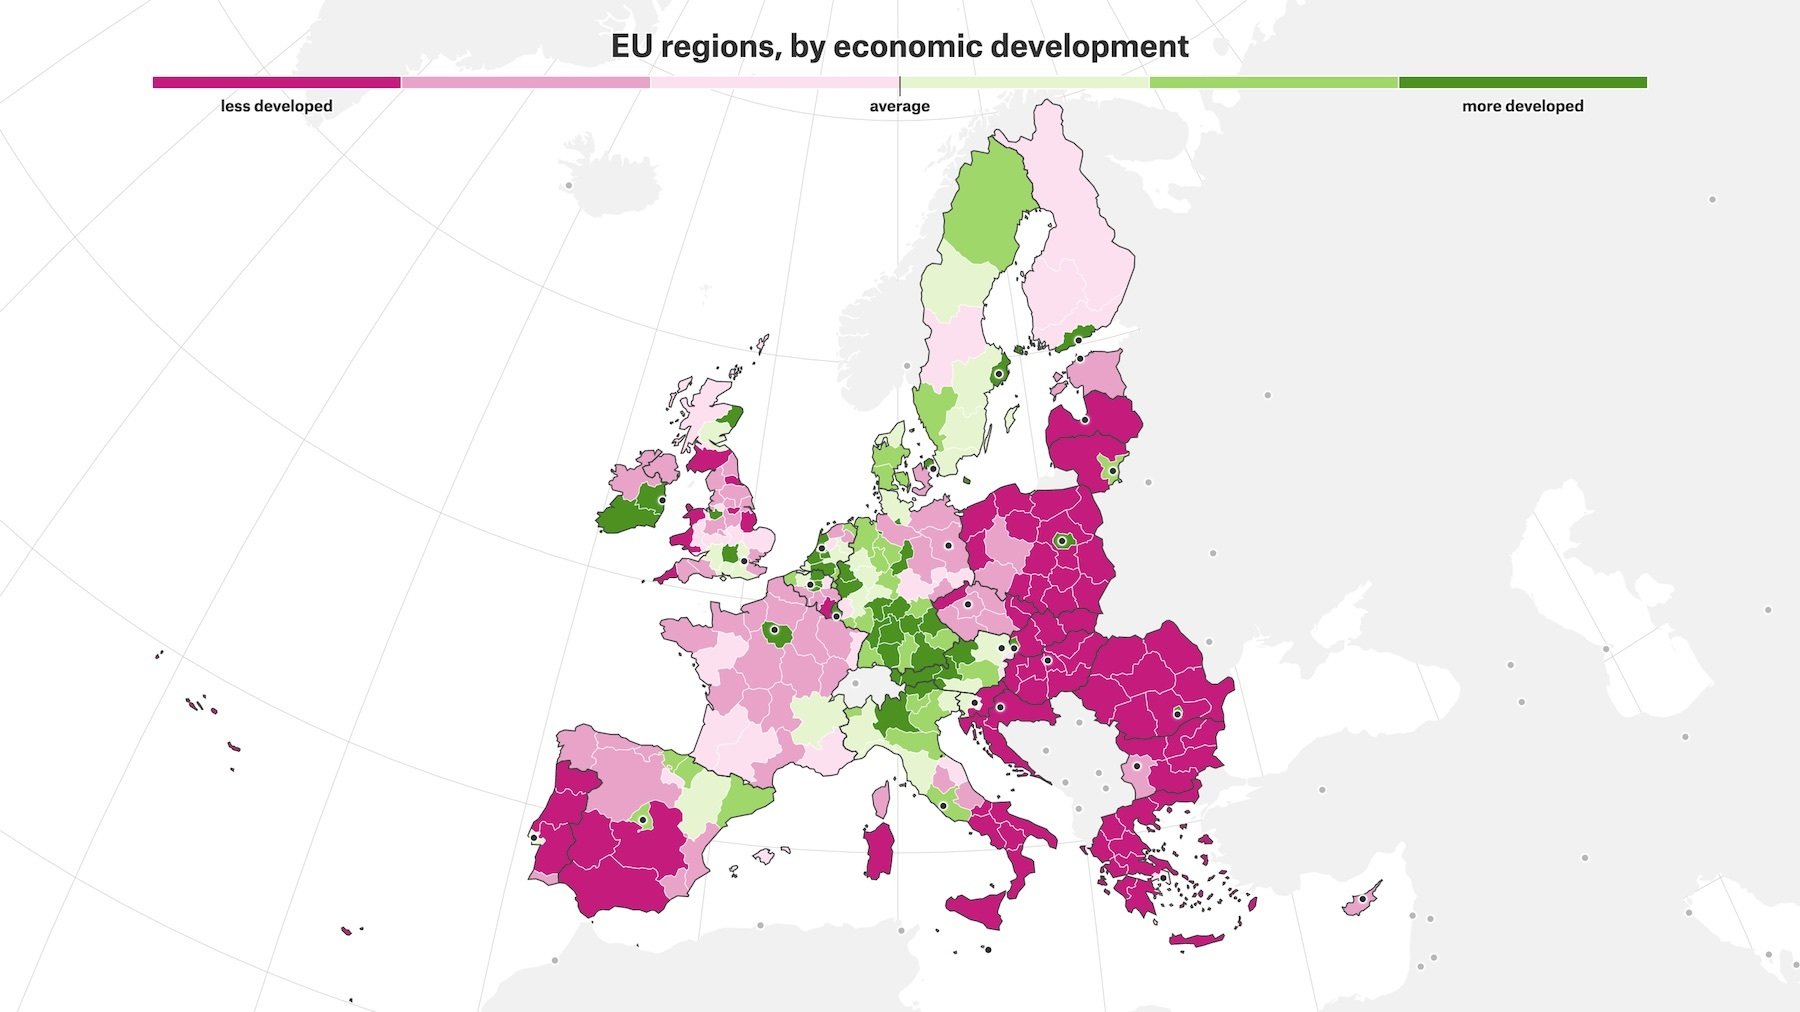
2016
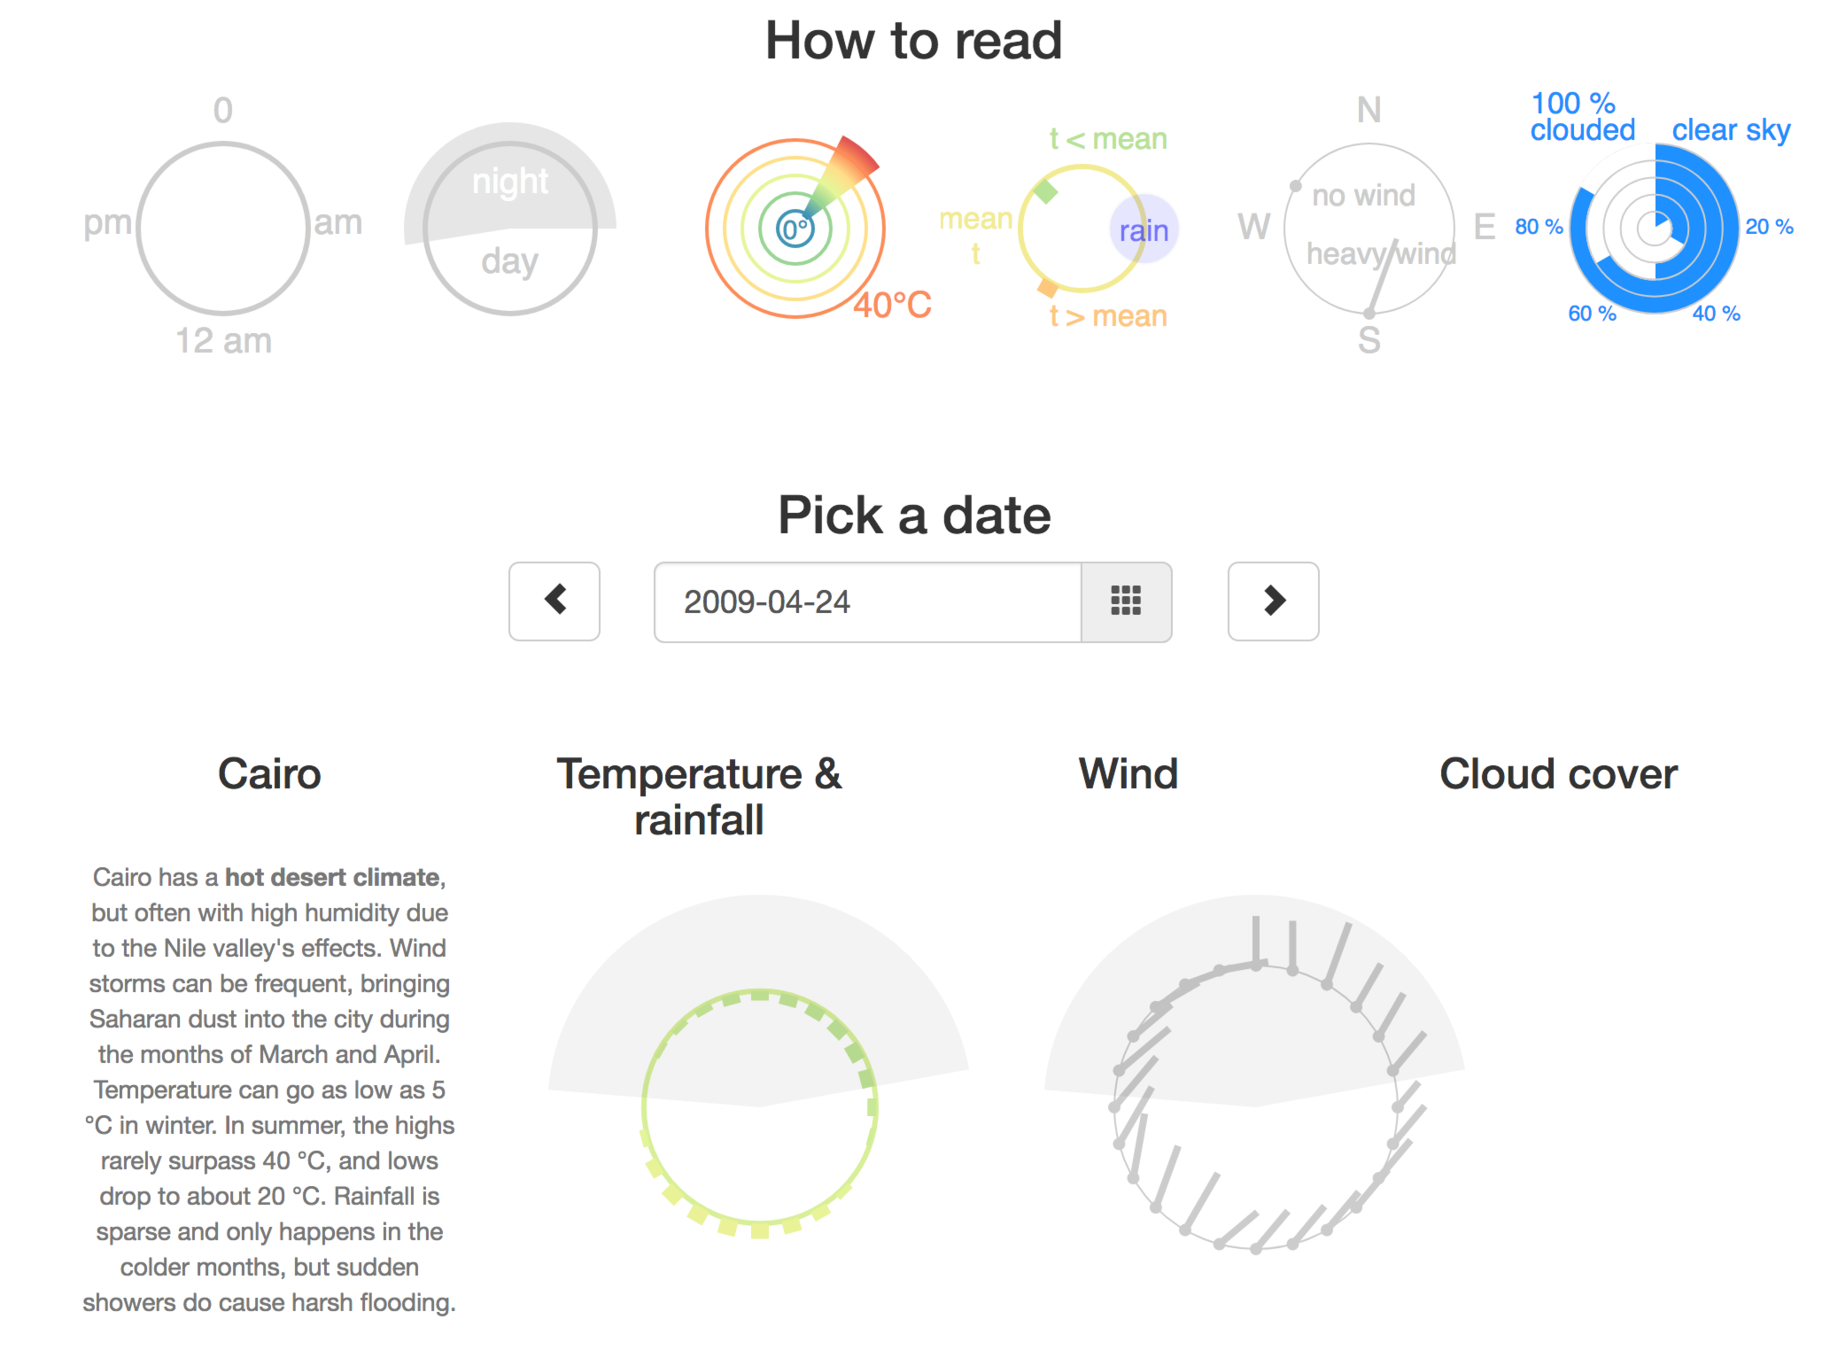
Malofiej Infographic Awards (✝ 2021)
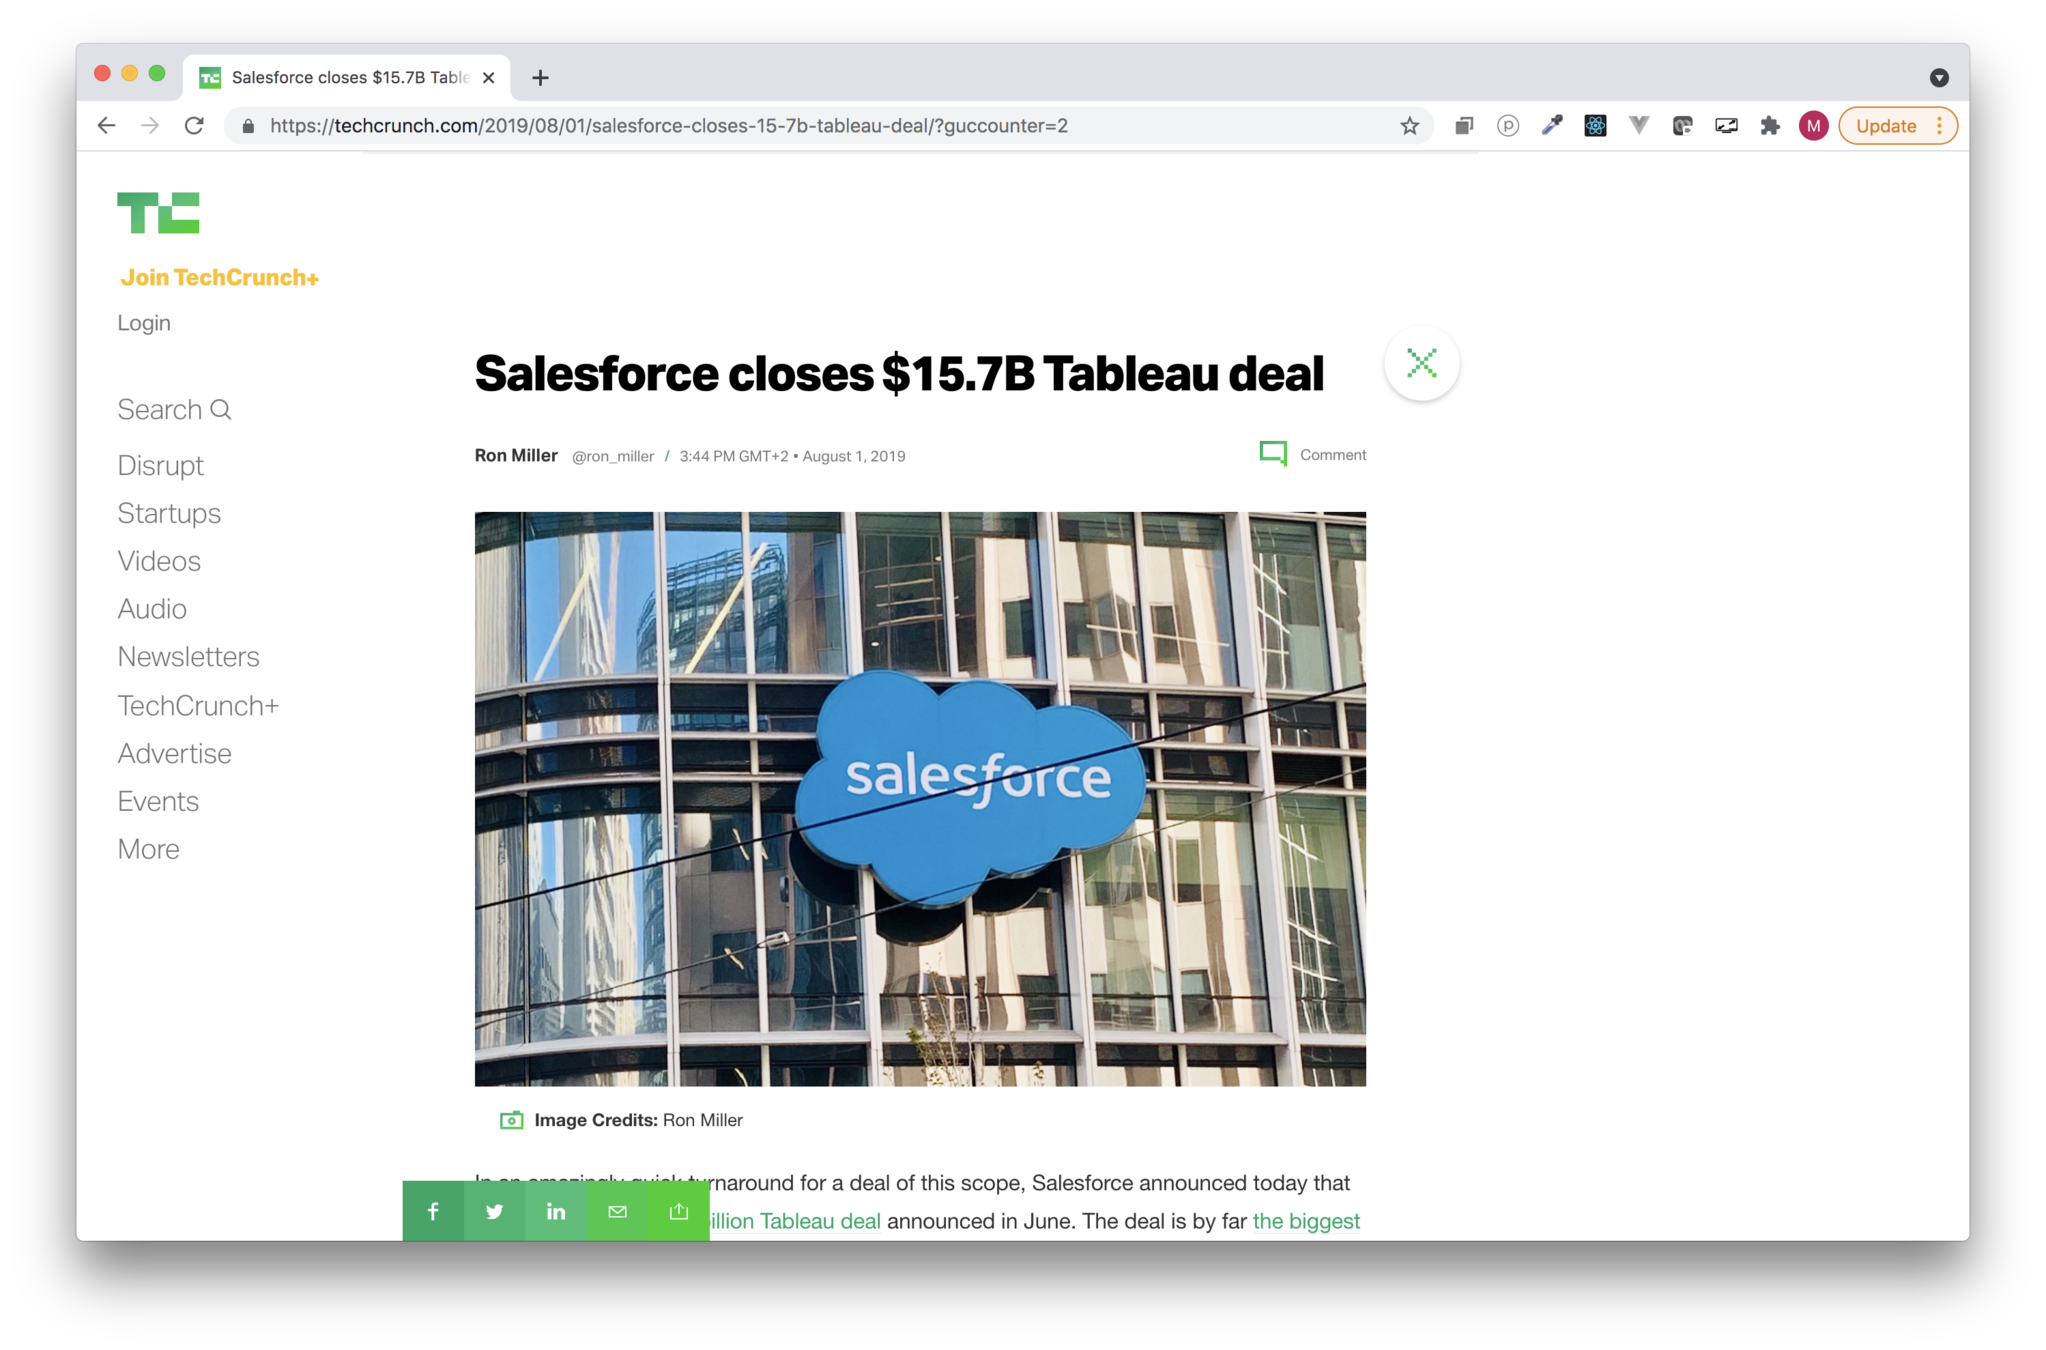
2017

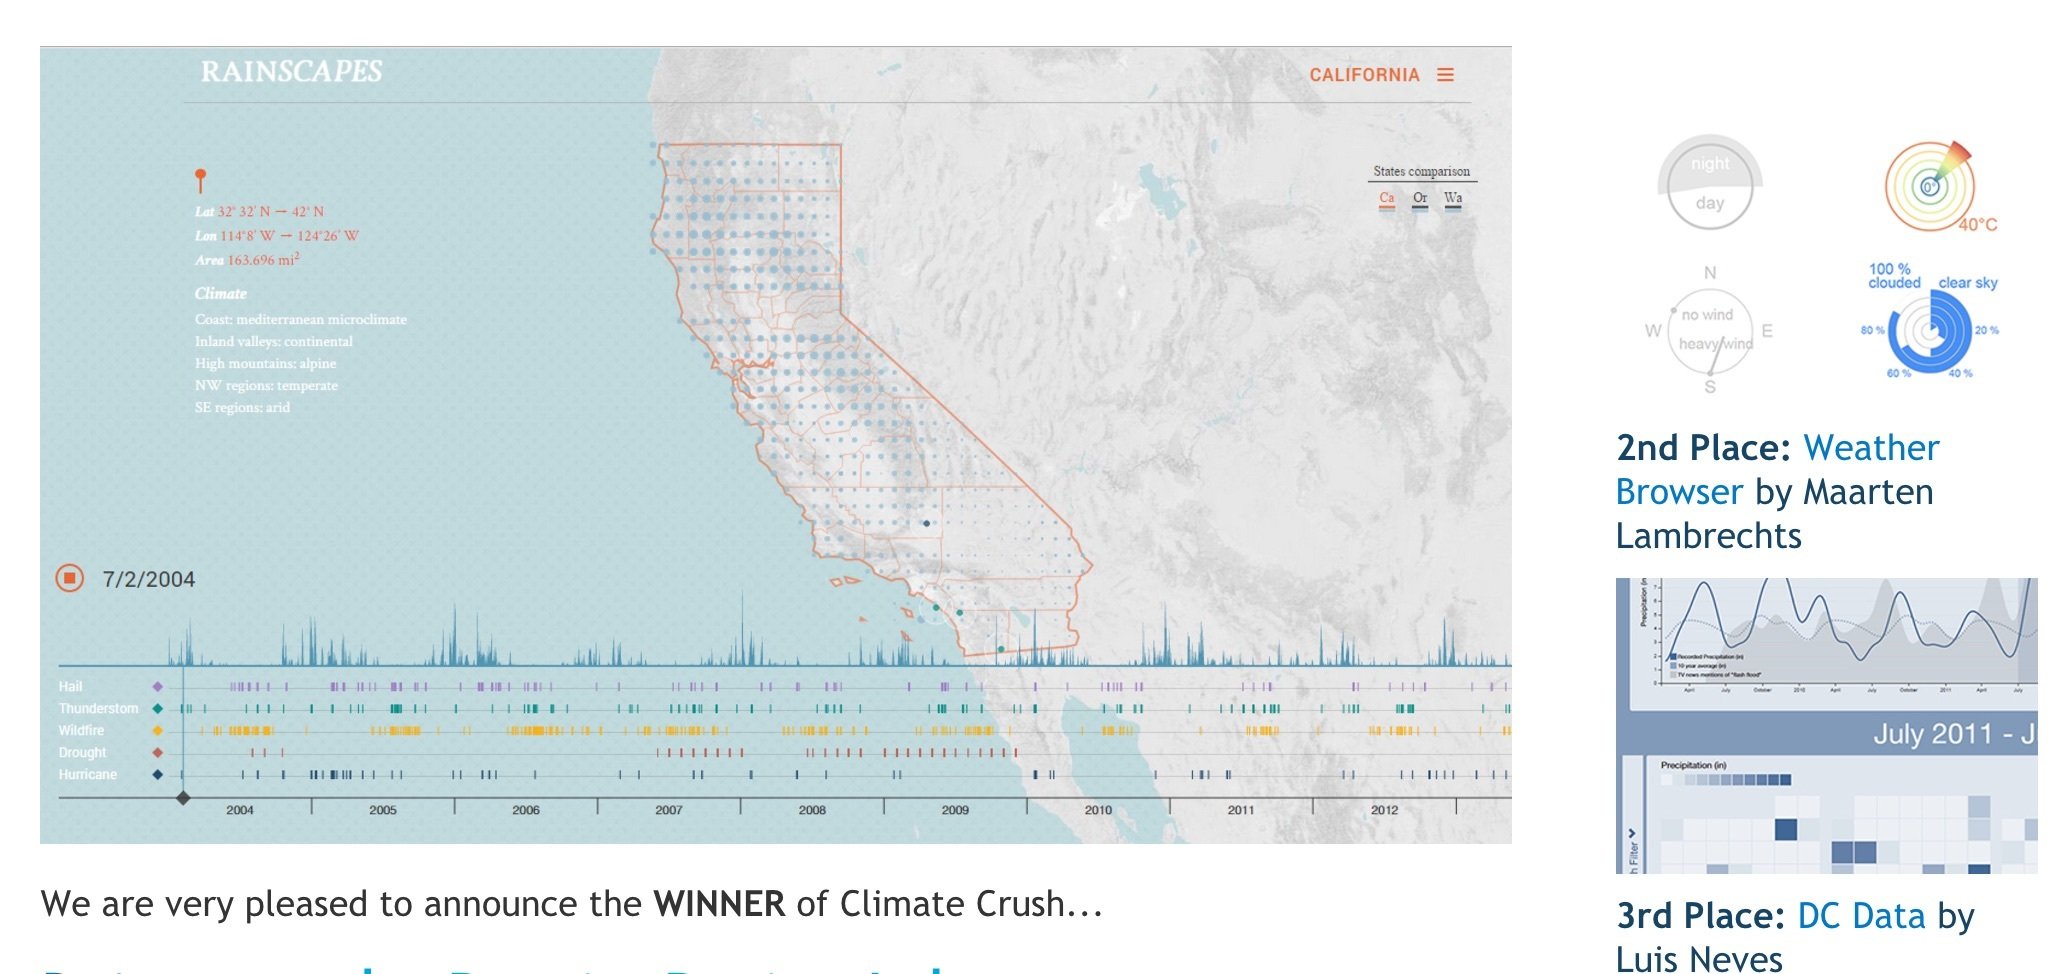
2019
| country | income | life expectancy |
|---|
Html
svg chart
D3
Flubber
d3-
scale
| country | income | life expectancy |
|---|
Html
svg chart
D3
Flubber
d3-scale
d3.scaleLinear()
d3.scaleLog()
Only import functions you need from modules (install them from npm)
| country | income | life expectancy |
|---|
Html
svg chart
D3
Flubber
D3-scale
d3.scaleLinear()
d3.scaleLog()
Bundle and minify for efficiency
(this requires a build step)
Bundle
| country | income | life expectancy |
|---|
Html
svg chart
D3
Flubber
D3-scale
d3.scaleLinear()
d3.scaleLog()
D3 still interacts with the DOM to add elements
Bundle
2020
| country | income | life expectancy |
|---|
Html
svg chart
D3
React
d3-scale
| country | income | life expectancy |
|---|
Html
svg chart
D3
React
d3-scale
React is a framework that controls what elements are rendered and updated (it controls the DOM)
| country | income | life expectancy |
|---|
Html
svg chart
D3
React
d3-scale
d3.scaleLog()
d3.scaleLinear()
But you can still use D3 modules and functions in React
| country | income | life expectancy |
|---|
Html
svg chart
D3
React
d3-scale
d3.scaleLog()
d3.scaleLinear()
D3 scales can calculate the x and y positions, color, size, ... of visual elements
| country | income | life expectancy |
|---|
Html
svg chart
D3
React
d3-scale
d3.scaleLog()
d3.scaleLinear()
But in the end, it is React that adds these elements to the page, and interacts with them
| country | income | life expectancy |
|---|
Html
svg chart
D3
React
d3-scale
d3.scaleLog()
d3.scaleLinear()
This means that you loose the the things D3 can do with elements, like transition properties
<svg width={width} height={height}>
    <g className="bubbles-g">
        {countries.map((d) => { // For each item in the countries array, a circle is returned
            return (
                <circle
                  key={"bubble-" + d.Country}
                  cx={xScale(d.coosshare)} //All the scales are d3 scales
                  cy={yScale(d.bmpshare)}
                  r={sizeScale(d.total)}
                  fill={colorScale(d.Region)}
                  stroke={
                    activeCountry === ""
                      ? highlightcountries.length === 0
                        ? "white"
                        : highlightcountries.includes(d.Country)
                        ? "black"
                        : "white"
                      : d.Country === activeCountry
                      ? "black"
                      : "white"
                  }
                  strokeWidth={...}
                  style={{ cursor: "pointer" }}
                  opacity={...}
                  onMouseOver={() => {//Show tooltip}}
                  onMouseLeave={() => {//Hide tooltip}}
                ></circle>
    </g>
</svg>
React & svg

2021
| country | income | life expectancy |
|---|
Html
svg chart
D3
Svelte
d3-scale
| country | income | life expectancy |
|---|
Html
svg chart
D3
Svelte
d3-scale
Svelte is a frontend framework, like React. It also controls the DOM
| country | income | life expectancy |
|---|
Html
svg chart
D3
Svelte
d3-scale
You can import and use D3 modules to calculate properties of elements, Svelte adds them to the document
| country | income | life expectancy |
|---|
Html
svg chart
D3
Svelte
d3-scale
But Svelte has built in functions for dataviz, like animation and measuring parent container dimensions
svelte/motion
| country | income | life expectancy |
|---|
Html
svg chart
D3
Svelte
d3-scale
But most importantly, on build time, Svelte compiles to just Javascript, and "disappears". Small bundle size, runs fast
svelte/motion
Bundle
Svelte (imo)
All advantages of frameworks (reusable components, reactivity), without the drawbacks (no complicated syntax, no big bundle size, no plugins needed for viz things like animations)

Learn Svelte
Thanks!
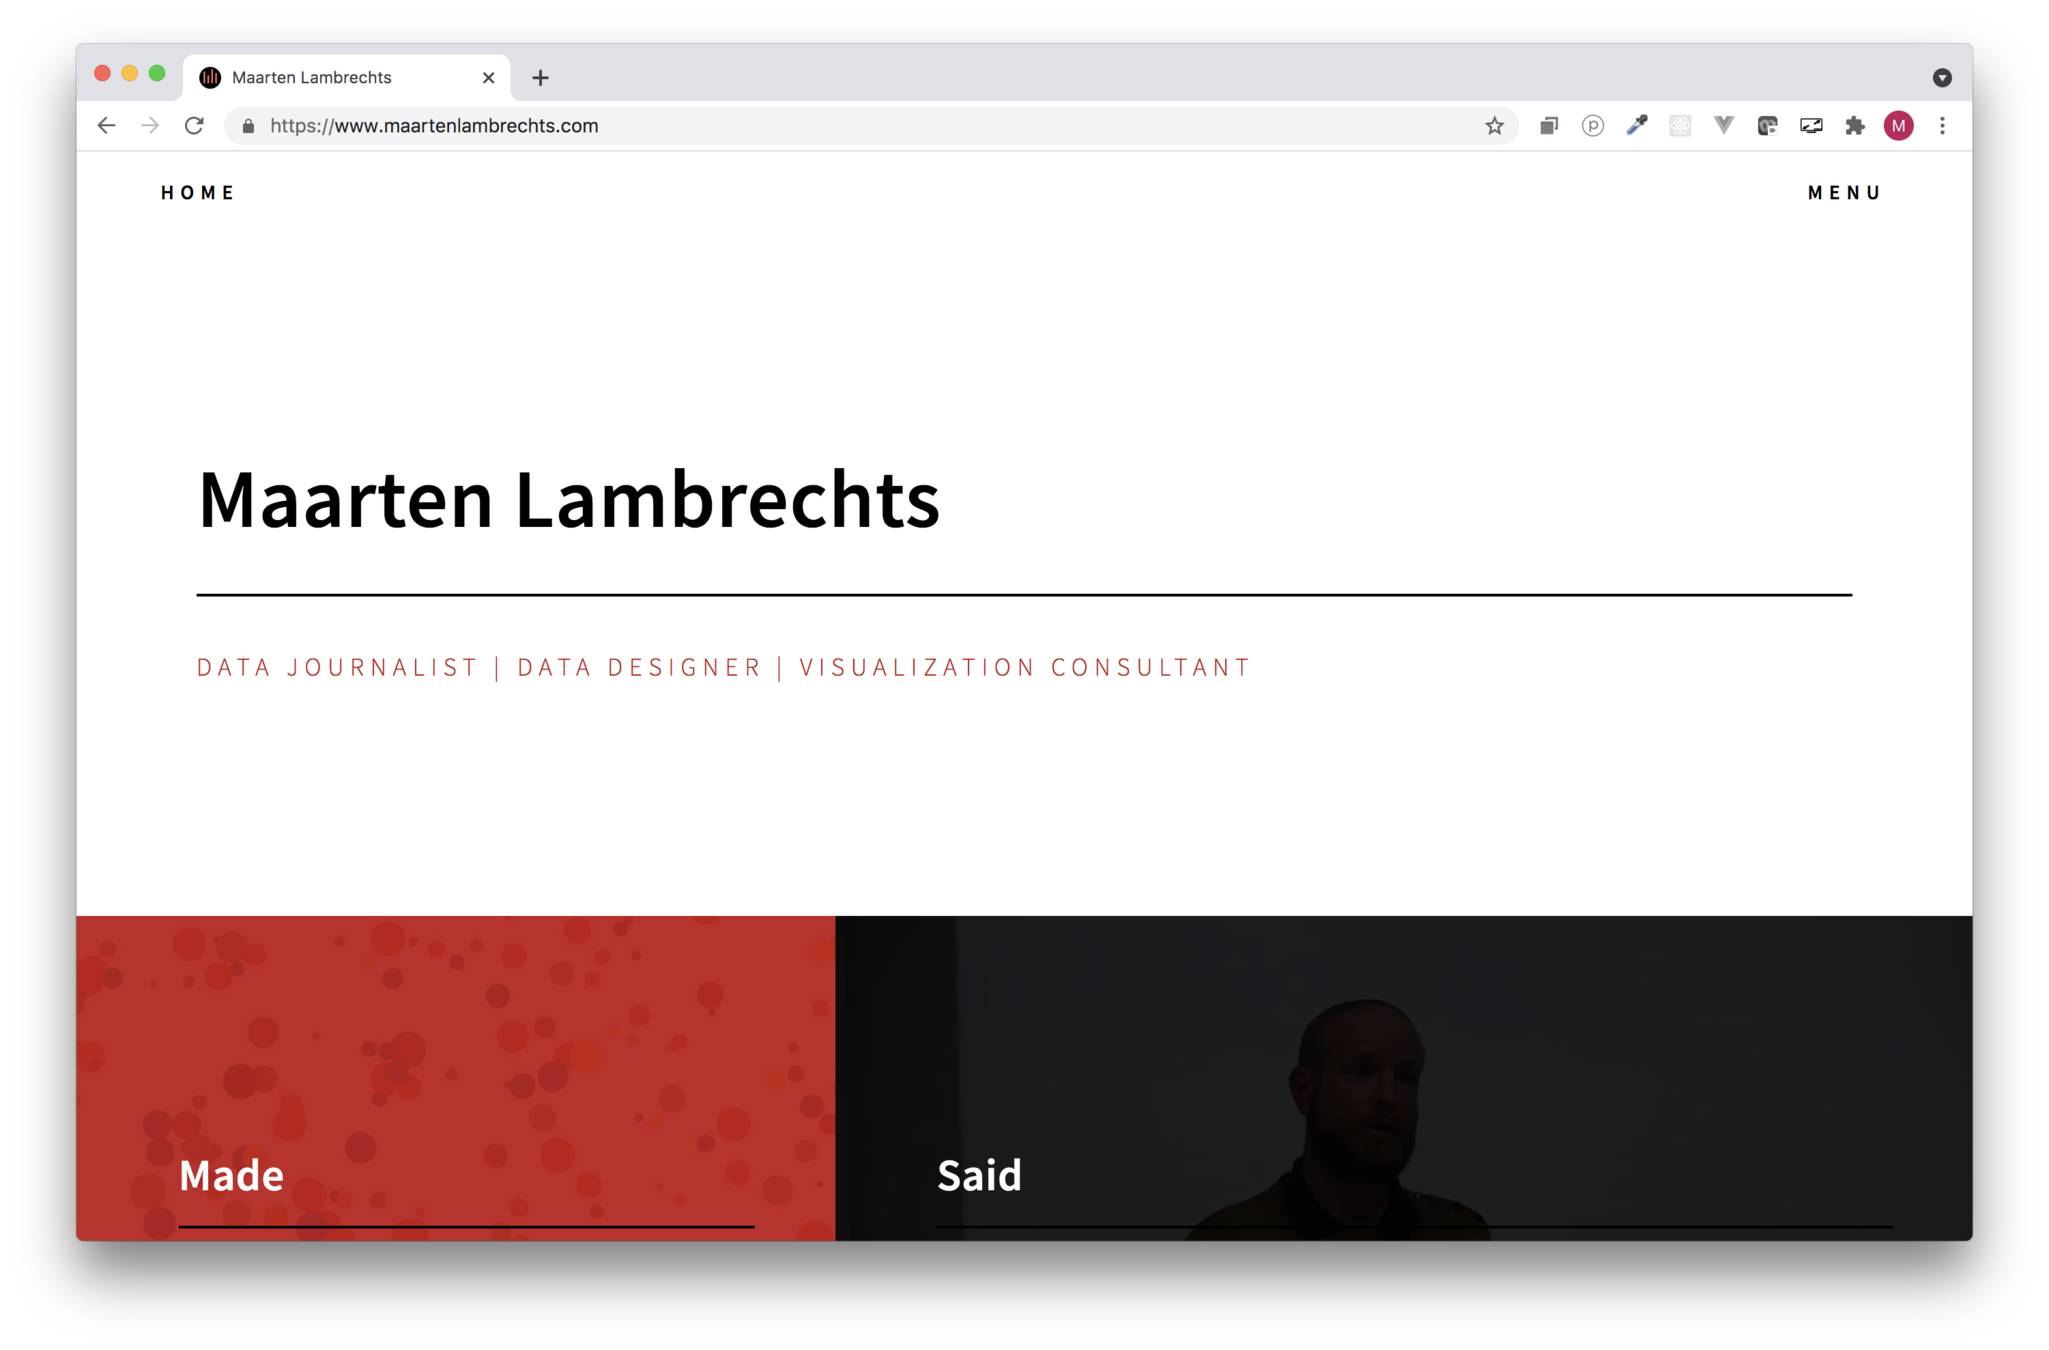
www.maartenlambrechts.com
@maartenzam
Dataviz journey
By maartenzam


